Google 2011 Annual Report Download - page 87
Download and view the complete annual report
Please find page 87 of the 2011 Google annual report below. You can navigate through the pages in the report by either clicking on the pages listed below, or by using the keyword search tool below to find specific information within the annual report.-
 1
1 -
2
-
3
-
4
-
5
-
6
-
7
-
8
-
9
-
10
-
11
-
12
-
13
-
14
-
15
-
16
-
17
-
18
-
19
-
20
-
21
-
22
-
23
-
24
-
25
-
26
-
27
-
28
-
29
-
30
-
31
-
32
-
33
-
34
-
35
-
36
-
37
-
38
-
39
-
40
-
41
-
42
-
43
-
44
-
45
-
46
-
47
-
48
-
49
-
50
-
51
-
52
-
53
-
54
-
55
-
56
-
57
-
58
-
59
-
60
-
61
-
62
-
63
-
64
-
65
-
66
-
67
-
68
-
69
-
70
-
71
-
72
-
73
-
74
-
75
-
76
-
 77
77 -
 78
78 -
 79
79 -
 80
80 -
 81
81 -
 82
82 -
 83
83 -
 84
84 -
 85
85 -
 86
86 -
 87
87 -
 88
88 -
 89
89 -
 90
90 -
 91
91 -
 92
92 -
 93
93 -
 94
94 -
 95
95 -
 96
96 -
 97
97 -
98
-
99
-
100
-
101
-
102
-
103
-
104
-
105
-
106
-
107
-
108
-
109
-
110
-
111
-
112
-
113
-
114
-
115
-
116
-
117
-
118
-
119
-
120
-
121
-
122
-
123
-
124
 |
 |
We include as part of cash flows from financing activities the benefits of tax deductions in excess of the
tax-effected compensation of the related stock-based awards for options exercised and RSUs vested during the
period. During the years ended December 31, 2009, December 31, 2010, and December 31, 2011, the amount of
cash received from the exercise of stock options was $350 million, $656 million, and $621 million, and the total
direct tax benefit realized, including the excess tax benefit, from stock-based award activities was $260 million,
$355 million, and $451 million. We have elected to account for the indirect effects of stock-based awards—
primarily the research and development tax credit—through the Consolidated Statements of Income.
For the years ended December 31, 2009, December 31, 2010, and December 31, 2011, we recognized stock-
based compensation and related tax benefits of $1,164 million and $264 million, $1,376 million and $314 million,
and $1,974 million and $413 million.
Certain Risks and Concentrations
Our revenues are principally derived from online advertising, the market for which is highly competitive and
rapidly changing. In addition, our revenues are generated from a multitude of vertical market segments in countries
around the world. Significant changes in this industry or changes in customer buying or advertiser spending
behavior could adversely affect our operating results.
Financial instruments that potentially subject us to concentrations of credit risk consist principally of cash
equivalents, marketable securities, foreign exchange contracts, and accounts receivable. Cash equivalents and
marketable securities consist primarily of highly liquid debt instruments of the U.S. government and its agencies,
municipalities in the U.S., debt instruments issued by foreign governments, mortgage-backed securities, corporate
securities, time deposits, and money market and other funds, including cash collateral received related to our
securities lending program. Foreign exchange contracts are transacted with various financial institutions with high
credit standing. Accounts receivable are typically unsecured and are derived from revenues earned from
customers located around the world. In 2009, 2010, and 2011, we generated approximately 47%, 48%, and 46%
of our revenues from customers based in the U.S., with the majority of customers outside of the U.S. located in
Europe and Japan. Many of our Google Network Members are in the internet industry. We perform ongoing
evaluations to determine customer credit and we limit the amount of credit we extend, but generally we do not
require collateral from our customers. We maintain reserves for estimated credit losses and these losses have
generally been within our expectations.
No individual customer or groups of affiliated customers represented more than 10% of our revenues in
2009, 2010, and 2011.
Fair Value of Financial Instruments
The carrying amounts of our financial instruments, including cash equivalents, accounts receivable, accounts
payable, short-term debt, and accrued liabilities, approximate fair value because of their generally short maturities.
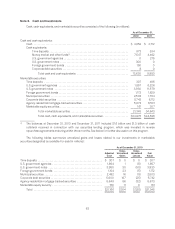
Cash, Cash Equivalents, and Marketable Securities
We invest our excess cash primarily in highly liquid debt instruments of the U.S. government and its agencies,
municipalities in the U.S., debt instruments issued by foreign governments, mortgage-backed securities, corporate
securities, time deposits, and money market and other funds, including cash collateral received related to our
securities lending program. We classify all highly liquid investments with stated maturities of three months or less
from date of purchase as cash equivalents and all highly liquid investments with stated maturities of greater than
three months as marketable securities.
We determine the appropriate classification of our investments in marketable securities at the time of
purchase and reevaluate such designation at each balance sheet date. We have classified and accounted for our
marketable securities as available-for-sale. We may or may not hold securities with stated maturities greater than
58