Google 2011 Annual Report Download - page 65
Download and view the complete annual report
Please find page 65 of the 2011 Google annual report below. You can navigate through the pages in the report by either clicking on the pages listed below, or by using the keyword search tool below to find specific information within the annual report.-
 1
1 -
2
-
3
-
4
-
5
-
6
-
7
-
8
-
9
-
10
-
11
-
12
-
13
-
14
-
15
-
16
-
17
-
18
-
19
-
20
-
21
-
22
-
23
-
24
-
25
-
26
-
27
-
28
-
29
-
30
-
31
-
32
-
33
-
34
-
35
-
36
-
37
-
38
-
39
-
40
-
41
-
42
-
43
-
44
-
45
-
46
-
47
-
48
-
49
-
50
-
51
-
52
-
53
-
54
-
 55
55 -
 56
56 -
 57
57 -
 58
58 -
 59
59 -
 60
60 -
 61
61 -
 62
62 -
 63
63 -
 64
64 -
 65
65 -
 66
66 -
 67
67 -
 68
68 -
 69
69 -
 70
70 -
 71
71 -
 72
72 -
 73
73 -
 74
74 -
 75
75 -
76
-
77
-
78
-
79
-
80
-
81
-
82
-
83
-
84
-
85
-
86
-
87
-
88
-
89
-
90
-
91
-
92
-
93
-
94
-
95
-
96
-
97
-
98
-
99
-
100
-
101
-
102
-
103
-
104
-
105
-
106
-
107
-
108
-
109
-
110
-
111
-
112
-
113
-
114
-
115
-
116
-
117
-
118
-
119
-
120
-
121
-
122
-
123
-
124
 |
 |

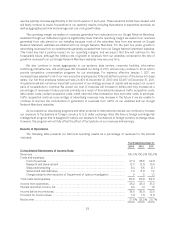
Stock-based compensation increased $598 million from 2010 to 2011. This increase was largely due to
additional stock awards issued to existing and new employees.
Stock-based compensation increased $212 million from 2009 to 2010. This increase was largely due to
additional stock awards issued to existing and new employees.
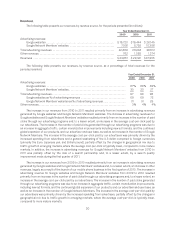
We estimate stock-based compensation to be approximately $2.0 billion in 2012 and $2.4 billion thereafter.
This estimate does not include expenses to be recognized related to employee stock awards that are granted after
December 31, 2011 or non-employee stock awards that have been or may be granted. In addition, to the extent
forfeiture rates are different from what we have anticipated, stock-based compensation related to these awards
will be different from our expectations.
Interest and Other Income, Net
Interest and other income, net increased $169 million from 2010 to 2011. This increase was primarily driven by
an increase in interest income of $233 million due to an increase in our cash and investment balances and higher
yields, as well as an increase in net realized gains on sales of available-for-sale investments of $69 million, partially
offset by an increase in interest expense of $53 million primarily related to our long-term debt program. In addition,
we recorded an impairment charge of $110 million related to certain equity investments during the year ended
December 31, 2011.
Interest and other income, net increased $346 million from 2009 to 2010. This increase was primarily driven
by an increase in interest income of $349 million due to an increase in our cash and investment balances and
higher yields, as well as an increase in net realized gains on sales of available-for-sale investments of $88 million.
These increases were partially offset by an increase in net foreign exchange related costs of $95 million primarily
related to our foreign exchange risk management program.
The costs of our foreign exchange hedging activities that we recognized to interest and other income, net are
primarily a function of the notional amount of the option and forward contracts and their related duration, the
movement of the foreign exchange rates relative to the strike prices of the contracts, as well as the volatility of the
foreign exchange rates.
As we expand our international business, we believe costs related to hedging activities under our foreign
exchange risk management program may increase in dollar amount in 2012 and future periods.
Provision for Income Taxes
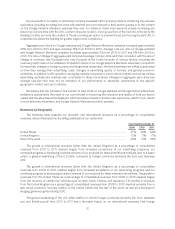
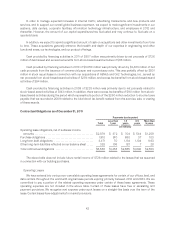
The following table presents our provision for income taxes, and effective tax rate for the periods presented
(dollars in millions):
Year Ended December 31,
2009 2010 2011
Provision for income taxes ..................................................... $1,861 $2,291 $2,589
Effective tax rate ............................................................. 22.2% 21.2% 21.0%
Our provision for income taxes increased from 2010 to 2011, primarily as a result of increases in federal
income taxes, driven by higher taxable income year over year, partially offset by proportionately more earnings
realized in countries that have lower statutory tax rates. Our effective tax rate decreased from 2010 to 2011,
primarily as a result of proportionately more earnings realized in countries that have lower statutory tax rates, a
decrease in state income taxes, and an increase in federal research and development credits recognized in 2011,
partially offset by recognition of a charge related to the resolution of an investigation by the Department of Justice
which is not deductible for tax purposes.
36