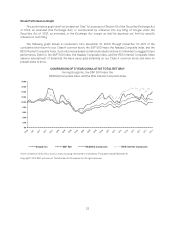
Google 2011 Annual Report Download - page 62
Download and view the complete annual report
Please find page 62 of the 2011 Google annual report below. You can navigate through the pages in the report by either clicking on the pages listed below, or by using the keyword search tool below to find specific information within the annual report.-
 1
1 -
2
-
3
-
4
-
5
-
6
-
7
-
8
-
9
-
10
-
11
-
12
-
13
-
14
-
15
-
16
-
17
-
18
-
19
-
20
-
21
-
22
-
23
-
24
-
25
-
26
-
27
-
28
-
29
-
30
-
31
-
32
-
33
-
34
-
35
-
36
-
37
-
38
-
39
-
40
-
41
-
42
-
43
-
44
-
45
-
46
-
47
-
48
-
49
-
50
-
51
-
 52
52 -
 53
53 -
 54
54 -
 55
55 -
 56
56 -
 57
57 -
 58
58 -
 59
59 -
 60
60 -
 61
61 -
 62
62 -
 63
63 -
 64
64 -
 65
65 -
 66
66 -
 67
67 -
 68
68 -
 69
69 -
 70
70 -
 71
71 -
 72
72 -
73
-
74
-
75
-
76
-
77
-
78
-
79
-
80
-
81
-
82
-
83
-
84
-
85
-
86
-
87
-
88
-
89
-
90
-
91
-
92
-
93
-
94
-
95
-
96
-
97
-
98
-
99
-
100
-
101
-
102
-
103
-
104
-
105
-
106
-
107
-
108
-
109
-
110
-
111
-
112
-
113
-
114
-
115
-
116
-
117
-
118
-
119
-
120
-
121
-
122
-
123
-
124
 |
 |

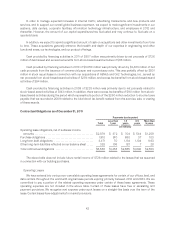
The following tables present our cost of revenues and cost of revenues as a percentage of revenues, and our
traffic acquisition costs, and traffic acquisition costs as a percentage of advertising revenues, for the periods
presented (dollars in millions):
Year Ended December 31,
2009 2010 2011
Cost of revenues ........................................................... $8,844 $10,417 $13,188
Cost of revenues as a percentage of revenues ................................. 37.4% 35.5% 34.8%
Year Ended December 31,
2009 2010 2011
Traffic acquisition costs related to AdSense arrangements ...................... $5,265 $ 6,162 $ 7,294
Traffic acquisition costs related to distribution arrangements .................... 904 1,155 1,517
Total traffic acquisition costs ................................................ $6,169 $ 7,317 $ 8,811
Traffic acquisition costs as a percentage of advertising revenues ................ 27.0% 25.9% 24.1%
Cost of revenues increased $2,771 million from 2010 to 2011. The increase was primarily related to an
increase in traffic acquisition costs of $1,132 million resulting from more advertiser fees generated through our
AdSense program. The increase was also related to an increase in traffic acquisition costs of $362 million from our
distribution arrangements as a result of more traffic directed to our websites, as well as more distribution fees paid.
The decrease in traffic acquisition costs as a percentage of advertising revenues was primarily due to an increase
in the proportion of advertising revenues from our websites compared to our Google Network Members’ websites,
more revenues realized from Google Network Members to whom we pay less revenue share, and, to a lesser extent,
expiration of an AdSense arrangement under which we paid guaranteed minimum revenue share. In addition, there
was an increase in data center costs of $784 million, primarily resulting from the depreciation of additional
information technology assets and data center buildings and an increase in labor, energy, and bandwidth costs,
and an increase in content acquisition costs of $236 million, primarily related to content displayed on YouTube,
partially offset by a decrease in mobile phone costs.
Cost of revenues increased $1,573 million from 2009 to 2010. The increase was primarily related to an
increase in traffic acquisition costs of $897 million resulting largely from more advertiser fees generated through
our AdSense program. The increase was also related to an increase in traffic acquisition costs of $251 million from
our distribution arrangements as a result of more traffic directed to our websites, as well as more distribution fees
paid. The decrease in traffic acquisition costs as a percentage of advertising revenues was primarily due to more
revenues realized from Google Network Members to whom we pay less revenue share, and expiration of an
AdSense arrangement under which we paid guaranteed minimum revenue share. In addition, there was an increase
in content acquisition costs of $169 million primarily related to content displayed on YouTube and an increase in
mobile phone costs.
We expect cost of revenues will increase in dollar amount and may increase as a percentage of revenues in
2012 and in future periods, primarily as a result of forecasted increases in traffic acquisition costs, data center
costs, credit card and other transaction fees, content acquisition costs, and other costs. Traffic acquisition costs
as a percentage of advertising revenues may fluctuate in the future based on a number of factors, including the
following:
• The relative growth rates of revenues from our websites and from our Google Network Members’
websites.
• Whether we are able to enter into more AdSense arrangements that provide for lower revenue share
obligations or whether increased competition for arrangements with existing and potential Google
Network Members results in less favorable revenue share arrangements.
• Whether we are able to continue to improve the monetization of traffic on our websites and our Google
Network Members’ websites.
33