Google 2011 Annual Report Download - page 64
Download and view the complete annual report
Please find page 64 of the 2011 Google annual report below. You can navigate through the pages in the report by either clicking on the pages listed below, or by using the keyword search tool below to find specific information within the annual report.-
 1
1 -
2
-
3
-
4
-
5
-
6
-
7
-
8
-
9
-
10
-
11
-
12
-
13
-
14
-
15
-
16
-
17
-
18
-
19
-
20
-
21
-
22
-
23
-
24
-
25
-
26
-
27
-
28
-
29
-
30
-
31
-
32
-
33
-
34
-
35
-
36
-
37
-
38
-
39
-
40
-
41
-
42
-
43
-
44
-
45
-
46
-
47
-
48
-
49
-
50
-
51
-
52
-
53
-
 54
54 -
 55
55 -
 56
56 -
 57
57 -
 58
58 -
 59
59 -
 60
60 -
 61
61 -
 62
62 -
 63
63 -
 64
64 -
 65
65 -
 66
66 -
 67
67 -
 68
68 -
 69
69 -
 70
70 -
 71
71 -
 72
72 -
 73
73 -
 74
74 -
75
-
76
-
77
-
78
-
79
-
80
-
81
-
82
-
83
-
84
-
85
-
86
-
87
-
88
-
89
-
90
-
91
-
92
-
93
-
94
-
95
-
96
-
97
-
98
-
99
-
100
-
101
-
102
-
103
-
104
-
105
-
106
-
107
-
108
-
109
-
110
-
111
-
112
-
113
-
114
-
115
-
116
-
117
-
118
-
119
-
120
-
121
-
122
-
123
-
124
 |
 |

Sales and marketing expenses increased $815 million from 2009 to 2010. This increase was primarily due to
an increase in advertising and promotional expense of $387 million. In addition, there was an increase in labor-
related costs of $254 million, largely as a result of a 20% increase in sales and marketing headcount, and higher
commission expense.
We expect that sales and marketing expenses will increase in dollar amount and may increase as a
percentage of revenues in 2012 and future periods, as we expand our business globally, increase advertising and
promotional expenditures in connection with new and existing products, and increase the level of service we
provide to our advertisers, Google Network Members, and other partners.
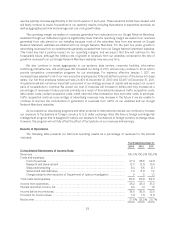
General and Administrative
The following table presents our general and administrative expenses, and general and administrative
expenses as a percentage of revenues for the periods presented (dollars in millions):
Year Ended December 31,
2009 2010 2011
General and administrative expenses ........................................... $1,668 $1,962 $2,724
General and administrative expenses as a percentage of revenues ................. 7.0% 6.8% 7.2%
General and administrative expenses consist primarily of compensation and related costs for personnel and
facilities, and include costs related to our facilities, finance, human resources, information technology, and legal
organizations, and fees for professional services. Professional services are principally comprised of outside legal,
audit, information technology consulting, and outsourcing services.
General and administrative expenses increased $762 million from 2010 to 2011. This increase was primarily
due to an increase in labor and facilities-related costs of $350 million, primarily as a result of a 37% increase in
general and administrative headcount and an increase in employee base salaries of approximately 10%, as well as
an increase in expense related to professional services of $260 million, the majority of which were related to
consulting services and legal costs. In addition, there was an increase in stock-based compensation of $116 million.
General and administrative expenses increased $294 million from 2009 to 2010. This increase was primarily
due to increases in expense related to professional services of $137 million, the majority of which were related to
legal and temporary services costs. In addition, there was an increase in labor-related costs of $64 million largely
as a result of a 14% increase in general and administrative headcount, and an increase in charitable contributions
of $64 million.
As we expand our business and incur additional expenses, we expect general and administrative expenses will
increase in dollar amount and may increase as a percentage of revenues in 2012 and future periods.
Charge Related to the Resolution of Department of Justice Investigation
In connection with a resolution of an investigation by the United States Department of Justice into the use of
Google advertising by certain advertisers, we accrued $500 million during the three months ended March 31, 2011,
which was paid in August 2011 upon final resolution of that matter.
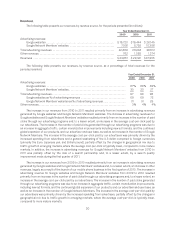
Stock-Based Compensation
The following table presents our stock-based compensation, and stock-based compensation as a percentage
of revenues for the periods presented (dollars in millions):
Year Ended December 31,
2009 2010 2011
Stock-based compensation .................................................... $1,164 $1,376 $1,974
Stock-based compensation as a percentage of revenues .......................... 4.9% 4.7% 5.2%
35