Google 2011 Annual Report Download - page 93
Download and view the complete annual report
Please find page 93 of the 2011 Google annual report below. You can navigate through the pages in the report by either clicking on the pages listed below, or by using the keyword search tool below to find specific information within the annual report.-
 1
1 -
2
-
3
-
4
-
5
-
6
-
7
-
8
-
9
-
10
-
11
-
12
-
13
-
14
-
15
-
16
-
17
-
18
-
19
-
20
-
21
-
22
-
23
-
24
-
25
-
26
-
27
-
28
-
29
-
30
-
31
-
32
-
33
-
34
-
35
-
36
-
37
-
38
-
39
-
40
-
41
-
42
-
43
-
44
-
45
-
46
-
47
-
48
-
49
-
50
-
51
-
52
-
53
-
54
-
55
-
56
-
57
-
58
-
59
-
60
-
61
-
62
-
63
-
64
-
65
-
66
-
67
-
68
-
69
-
70
-
71
-
72
-
73
-
74
-
75
-
76
-
77
-
78
-
79
-
80
-
81
-
82
-
 83
83 -
 84
84 -
 85
85 -
 86
86 -
 87
87 -
 88
88 -
 89
89 -
 90
90 -
 91
91 -
 92
92 -
 93
93 -
 94
94 -
 95
95 -
 96
96 -
 97
97 -
 98
98 -
 99
99 -
 100
100 -
 101
101 -
 102
102 -
 103
103 -
104
-
105
-
106
-
107
-
108
-
109
-
110
-
111
-
112
-
113
-
114
-
115
-
116
-
117
-
118
-
119
-
120
-
121
-
122
-
123
-
124
 |
 |

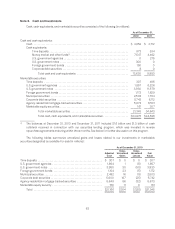
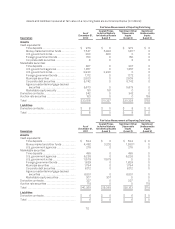
As of December 31, 2011
Adjusted
Cost
Gross
Unrealized
Gains
Gross
Unrealized
Losses Fair
Value
Time deposits ................................................. $ 495 $ 0 $ 0 $ 495
U.S. government agencies ...................................... 6,211 15 0 6,226
U.S. government notes ......................................... 11,475 104 0 11,579
Foreign government bonds ..................................... 1,608 32 (11) 1,629
Municipal securities ............................................ 1,775 19 0 1,794
Corporate debt securities ....................................... 6,023 187 (98) 6,112
Agency residential mortgage-backed securities ................... 6,359 147 (5) 6,501
Marketable equity securities .................................... 228 79 0 307
Total .................................................... $34,174 $583 $(114) $34,643
Gross unrealized gains and losses on cash equivalents were not material at December 31, 2010 and
December 31, 2011.
We recognized gross realized gains of $212 million and $381 million for the years ended December 31, 2010
and 2011. We recognized gross realized losses of $27 million and $127 million for the years ended December 31,
2010 and 2011. We determine realized gains or losses on the sale of marketable securities on a specific
identification method, and we reflect such gains and losses as a component of interest and other income, net, in
our accompanying Consolidated Statements of Income.
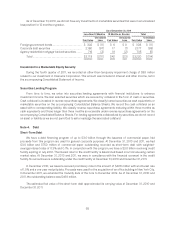
The following table summarizes the estimated fair value of our investments in marketable securities,
excluding the marketable equity securities, designated as available-for-sale and classified by the contractual
maturity date of the securities (in millions):
As of
December 31,
2011
Due in 1 year .............................................................................. $13,242
Due in 1 year through 5 years ............................................................... 7,482
Due in 5 years through 10 years ............................................................. 5,525
Due after 10 years ......................................................................... 8,087
Total ................................................................................ $34,336
The following tables present gross unrealized losses and fair values for those investments that were in an
unrealized loss position as of December 31, 2010 and 2011, aggregated by investment category and the length of
time that individual securities have been in a continuous loss position (in millions):
As of December 31, 2010
Less than 12 Months
Fair Value Unrealized
Loss
U.S. government agencies ......................................................... $ 831 $ (8)
U.S. government notes ............................................................ 2,225 (50)
Foreign government bonds ........................................................ 129 (5)
Municipal securities .............................................................. 962 (5)
Corporate debt securities ......................................................... 1,061 (25)
Agency residential mortgage-backed securities ...................................... 1,675 (32)
Total ....................................................................... $6,883 $(125)
64