Google 2011 Annual Report Download - page 92
Download and view the complete annual report
Please find page 92 of the 2011 Google annual report below. You can navigate through the pages in the report by either clicking on the pages listed below, or by using the keyword search tool below to find specific information within the annual report.-
 1
1 -
2
-
3
-
4
-
5
-
6
-
7
-
8
-
9
-
10
-
11
-
12
-
13
-
14
-
15
-
16
-
17
-
18
-
19
-
20
-
21
-
22
-
23
-
24
-
25
-
26
-
27
-
28
-
29
-
30
-
31
-
32
-
33
-
34
-
35
-
36
-
37
-
38
-
39
-
40
-
41
-
42
-
43
-
44
-
45
-
46
-
47
-
48
-
49
-
50
-
51
-
52
-
53
-
54
-
55
-
56
-
57
-
58
-
59
-
60
-
61
-
62
-
63
-
64
-
65
-
66
-
67
-
68
-
69
-
70
-
71
-
72
-
73
-
74
-
75
-
76
-
77
-
78
-
79
-
80
-
81
-
 82
82 -
 83
83 -
 84
84 -
 85
85 -
 86
86 -
 87
87 -
 88
88 -
 89
89 -
 90
90 -
 91
91 -
 92
92 -
 93
93 -
 94
94 -
 95
95 -
 96
96 -
 97
97 -
 98
98 -
 99
99 -
 100
100 -
 101
101 -
 102
102 -
103
-
104
-
105
-
106
-
107
-
108
-
109
-
110
-
111
-
112
-
113
-
114
-
115
-
116
-
117
-
118
-
119
-
120
-
121
-
122
-
123
-
124
 |
 |

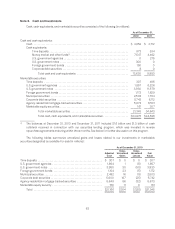
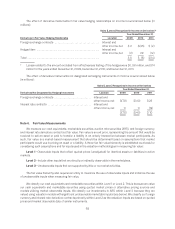
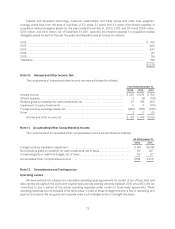
Note 3. Cash and Investments
Cash, cash equivalents, and marketable securities consisted of the following (in millions):
As of December 31,
2010 2011
Cash and cash equivalents:
Cash ........................................................................ $ 4,652 $ 4,712
Cash equivalents:
Time deposits ............................................................ 973 534
Money market and other funds(1) ............................................ 7,547 4,462
U.S. government agencies ................................................. 0 275
U.S. government notes .................................................... 300 0
Foreign government bonds ................................................ 150 0
Corporate debt securities .................................................. 8 0
Total cash and cash equivalents ....................................... 13,630 9,983
Marketable securities:
Time deposits ................................................................ 307 495
U.S. government agencies ..................................................... 1,857 6,226
U.S. government notes ........................................................ 3,930 11,579
Foreign government bonds ..................................................... 1,172 1,629
Municipal securities ........................................................... 2,503 1,794
Corporate debt securities ...................................................... 5,742 6,112
Agency residential mortgage-backed securities ................................... 5,673 6,501
Marketable equity securities .................................................... 161 307
Total marketable securities ............................................ 21,345 34,643
Total cash, cash equivalents, and marketable securities ................... $34,975 $44,626
(1) The balances at December 31, 2010 and December 31, 2011 included $1.6 billion and $1.3 billion of cash
collateral received in connection with our securities lending program, which was invested in reverse
repurchase agreements maturing within three months. See below for further discussion on this program.
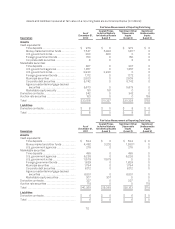
The following tables summarize unrealized gains and losses related to our investments in marketable
securities designated as available-for-sale (in millions):
As of December 31, 2010
Adjusted
Cost
Gross
Unrealized
Gains
Gross
Unrealized
Losses Fair
Value
Time deposits ................................................. $ 307 $ 0 $ 0 $ 307
U.S. government agencies ...................................... 1,864 1 (8) 1,857
U.S. government notes ......................................... 3,950 30 (50) 3,930
Foreign government bonds ..................................... 1,154 23 (5) 1,172
Municipal securities ............................................ 2,492 16 (5) 2,503
Corporate debt securities ....................................... 5,600 167 (25) 5,742
Agency residential mortgage-backed securities ................... 5,649 56 (32) 5,673
Marketable equity security ...................................... 150 11 0 161
Total .................................................... $21,166 $304 $(125) $21,345
63