Google 2011 Annual Report Download - page 106
Download and view the complete annual report
Please find page 106 of the 2011 Google annual report below. You can navigate through the pages in the report by either clicking on the pages listed below, or by using the keyword search tool below to find specific information within the annual report.-
 1
1 -
2
-
3
-
4
-
5
-
6
-
7
-
8
-
9
-
10
-
11
-
12
-
13
-
14
-
15
-
16
-
17
-
18
-
19
-
20
-
21
-
22
-
23
-
24
-
25
-
26
-
27
-
28
-
29
-
30
-
31
-
32
-
33
-
34
-
35
-
36
-
37
-
38
-
39
-
40
-
41
-
42
-
43
-
44
-
45
-
46
-
47
-
48
-
49
-
50
-
51
-
52
-
53
-
54
-
55
-
56
-
57
-
58
-
59
-
60
-
61
-
62
-
63
-
64
-
65
-
66
-
67
-
68
-
69
-
70
-
71
-
72
-
73
-
74
-
75
-
76
-
77
-
78
-
79
-
80
-
81
-
82
-
83
-
84
-
85
-
86
-
87
-
88
-
89
-
90
-
91
-
92
-
93
-
94
-
95
-
 96
96 -
 97
97 -
 98
98 -
 99
99 -
 100
100 -
 101
101 -
 102
102 -
 103
103 -
 104
104 -
 105
105 -
 106
106 -
 107
107 -
 108
108 -
 109
109 -
 110
110 -
 111
111 -
 112
112 -
 113
113 -
 114
114 -
 115
115 -
 116
116 -
117
-
118
-
119
-
120
-
121
-
122
-
123
-
124
 |
 |

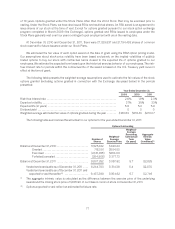
of 10 years. Options granted under the Stock Plans other than the 2004 Stock Plan may be exercised prior to
vesting. Under the Stock Plans, we have also issued RSUs and restricted shares. An RSU award is an agreement to
issue shares of our stock at the time of vest. Except for options granted pursuant to our stock option exchange
program completed in March 2009 (the Exchange), options granted and RSUs issued to employees under the
Stock Plans generally vest over four years contingent upon employment with us on the vesting date.
At December 31, 2010 and December 31, 2011, there were 27,329,837 and 21,794,492 shares of common
stock reserved for future issuance under our Stock Plans.
We estimated the fair value of each option award on the date of grant using the BSM option pricing model.
Our assumptions about stock-price volatility have been based exclusively on the implied volatilities of publicly
traded options to buy our stock with contractual terms closest to the expected life of options granted to our
employees. We estimate the expected term based upon the historical exercise behavior of our employees. The risk-
free interest rate for periods within the contractual life of the award is based on the U.S. Treasury yield curve in
effect at the time of grant.
The following table presents the weighted-average assumptions used to estimate the fair values of the stock
options granted (excluding options granted in connection with the Exchange discussed below) in the periods
presented:
Year Ended December 31,
2009 2010 2011
Risk-free interest rate ..................................................... 2.6% 1.9% 2.3%
Expected volatility ........................................................ 37% 35% 33%
Expected life (in years) .................................................... 5.8 5.4 5.9
Dividend yield ............................................................ 0 0 0
Weighted-average estimated fair value of options granted during the year ....... $160.63 $216.43 $210.07
The following table summarizes the activities for our options for the year ended December 31, 2011:
Options Outstanding
Number of
Shares
Weighted-
Average
Exercise Price
Weighted-
Average
Remaining
Contractual
Term
(in years)
Aggregate
Intrinsic
Value
(in millions)(1)
Balance at December 31, 2010 ........................ 11,525,422 $330.24
Granted ................................... 718,091 $584.80
Exercised ................................. (2,181,355) $284.00
Forfeited/canceled ......................... (254,906) $ 377.73
Balance at December 31, 2011 ........................ 9,807,252 $ 357.92 5.7 $2,825
Vested and exercisable as of December 31, 2011 .... 6,244,783 $ 314.38 5.4 $2,070
Vested and exercisable as of December 31, 2011 and
expected to vest thereafter(2) .................. 9,437,288 $ 354.92 5.7 $2,746
(1) The aggregate intrinsic value is calculated as the difference between the exercise price of the underlying
awards and the closing stock price of $645.90 of our Class A common stock on December 31, 2011.
(2) Options expected to vest reflect an estimated forfeiture rate.
77