Google 2011 Annual Report Download - page 61
Download and view the complete annual report
Please find page 61 of the 2011 Google annual report below. You can navigate through the pages in the report by either clicking on the pages listed below, or by using the keyword search tool below to find specific information within the annual report.-
 1
1 -
2
-
3
-
4
-
5
-
6
-
7
-
8
-
9
-
10
-
11
-
12
-
13
-
14
-
15
-
16
-
17
-
18
-
19
-
20
-
21
-
22
-
23
-
24
-
25
-
26
-
27
-
28
-
29
-
30
-
31
-
32
-
33
-
34
-
35
-
36
-
37
-
38
-
39
-
40
-
41
-
42
-
43
-
44
-
45
-
46
-
47
-
48
-
49
-
50
-
 51
51 -
 52
52 -
 53
53 -
 54
54 -
 55
55 -
 56
56 -
 57
57 -
 58
58 -
 59
59 -
 60
60 -
 61
61 -
 62
62 -
 63
63 -
 64
64 -
 65
65 -
 66
66 -
 67
67 -
 68
68 -
 69
69 -
 70
70 -
 71
71 -
72
-
73
-
74
-
75
-
76
-
77
-
78
-
79
-
80
-
81
-
82
-
83
-
84
-
85
-
86
-
87
-
88
-
89
-
90
-
91
-
92
-
93
-
94
-
95
-
96
-
97
-
98
-
99
-
100
-
101
-
102
-
103
-
104
-
105
-
106
-
107
-
108
-
109
-
110
-
111
-
112
-
113
-
114
-
115
-
116
-
117
-
118
-
119
-
120
-
121
-
122
-
123
-
124
 |
 |
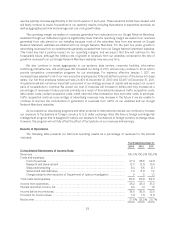
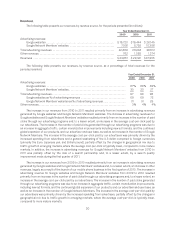
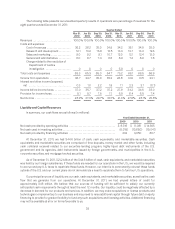
exchange rates remained constant in these periods, our revenues from the United Kingdom would have been $129
million, or 3.2%, lower and our revenues from the rest of the world would have been approximately $834 million, or
5.1%, lower in 2011. This is before consideration of hedging gains of $9 million and $34 million recognized to
revenues from the United Kingdom and the rest of the world in 2011.
The general strengthening of the U.S. dollar relative to certain foreign currencies (primarily the Euro) from
2009 to 2010 had an unfavorable impact on our international revenues. Had foreign exchange rates remained
constant in these periods, our revenues from the United Kingdom would have been approximately $10 million, or
0.3% higher, and our revenues from the rest of the world would have been approximately $25 million, or 0.2%
higher in 2010. This is before consideration of hedging gains of $42 million and $161 million recognized to
revenues from the United Kingdom and the rest of the world in 2010.
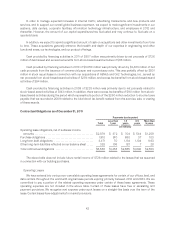
Although we expect to continue to make investments in international markets, these investments may not
result in an increase in our international revenues as a percentage of total revenues in 2012 or thereafter. See
Note 16 of Notes to Consolidated Financial Statements included in Item 8 of this Annual Report on Form 10-K for
additional information about geographic areas.
Costs and Expenses
Cost of Revenues
Cost of revenues consists primarily of traffic acquisition costs. Traffic acquisition costs consist of amounts
ultimately paid to our Google Network Members under AdSense arrangements and to certain other partners (our
distribution partners) who distribute our toolbar and other products (collectively referred to as access points) or
otherwise direct search queries to our website (collectively referred to as distribution arrangements). These
amounts are primarily based on the revenue share and fixed fee arrangements with our Google Network Members
and distribution partners.
Certain distribution arrangements require us to pay our partners based on a fee per access point delivered and
not exclusively—or at all—based on revenue share. These fees are non-refundable. Further, these arrangements
are terminable at will, although under the terms of certain contracts we or our distribution partners may be subject
to penalties in the event of early termination. We recognize fees under these arrangements over the estimated
useful lives of the access points (approximately two years) to the extent we can reasonably estimate those lives
and they are longer than one year, or based on any contractual revenue share, if greater. Otherwise, the fees are
charged to expense as incurred. The estimated useful life of the access points is based on the historical average
period of time they generate traffic and revenues.
Cost of revenues also includes the expenses associated with the operation of our data centers, including
depreciation, labor, energy, and bandwidth costs, credit card and other transaction fees related to processing
customer transactions including Google Checkout transactions, amortization of acquired intangible assets, as well
as content acquisition costs. We have entered into arrangements with certain content providers under which we
distribute or license their video and other content. In a number of these arrangements, we display ads on the pages
of our websites from which the content is viewed and share most of the fees these ads generate with the content
providers. To the extent we are obligated to make guaranteed minimum revenue share payments to our content
providers, we recognize as content acquisition costs the contractual revenue share amount or on a straight-line
basis, whichever is greater, over the terms of the agreements.
32