Google 2011 Annual Report Download - page 100
Download and view the complete annual report
Please find page 100 of the 2011 Google annual report below. You can navigate through the pages in the report by either clicking on the pages listed below, or by using the keyword search tool below to find specific information within the annual report.-
 1
1 -
2
-
3
-
4
-
5
-
6
-
7
-
8
-
9
-
10
-
11
-
12
-
13
-
14
-
15
-
16
-
17
-
18
-
19
-
20
-
21
-
22
-
23
-
24
-
25
-
26
-
27
-
28
-
29
-
30
-
31
-
32
-
33
-
34
-
35
-
36
-
37
-
38
-
39
-
40
-
41
-
42
-
43
-
44
-
45
-
46
-
47
-
48
-
49
-
50
-
51
-
52
-
53
-
54
-
55
-
56
-
57
-
58
-
59
-
60
-
61
-
62
-
63
-
64
-
65
-
66
-
67
-
68
-
69
-
70
-
71
-
72
-
73
-
74
-
75
-
76
-
77
-
78
-
79
-
80
-
81
-
82
-
83
-
84
-
85
-
86
-
87
-
88
-
89
-
 90
90 -
 91
91 -
 92
92 -
 93
93 -
 94
94 -
 95
95 -
 96
96 -
 97
97 -
 98
98 -
 99
99 -
 100
100 -
 101
101 -
 102
102 -
 103
103 -
 104
104 -
 105
105 -
 106
106 -
 107
107 -
 108
108 -
 109
109 -
 110
110 -
111
-
112
-
113
-
114
-
115
-
116
-
117
-
118
-
119
-
120
-
121
-
122
-
123
-
124
 |
 |

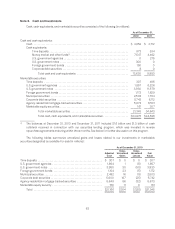
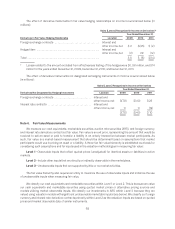
(1) This balance represents cash collateral received in connection with our securities lending program, which was
invested in reverse repurchase agreements maturing within three months.
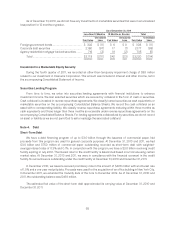
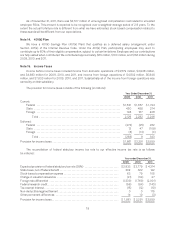
At December 31, 2011, we held $118 million of ARS. Historically, these securities have provided liquidity
through a Dutch auction process. However, these auctions began to fail in the first quarter of 2008. To estimate
their fair values at December 31, 2011, we used a discounted cash flow model based on estimated interest rates,
timing and amount of cash flows, the credit quality of the underlying securities, and illiquidity considerations.
At December 31, 2011, the estimated fair value of these ARS was $23 million below their costs. As we have no
intent to sell these ARS and it is more likely than not that we will not be required to sell these ARS prior to recovery
of our entire cost basis, we concluded the decline in the fair value was temporary and recorded the unrealized loss
to AOCI on the accompanying Consolidated Balance Sheet at December 31, 2011. To the extent we determine that
any impairment is other-than-temporary, we would record a charge to earnings. In addition, we have concluded
that the auctions for these securities may continue to fail for at least the next 12 months and as a result, we
classified them as non-current assets on the accompanying Consolidated Balance Sheet at December 31, 2011.
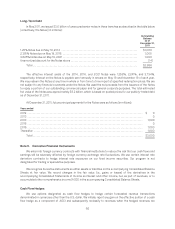
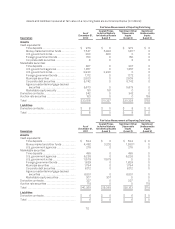
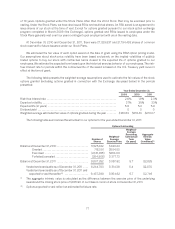
The following table presents reconciliations for our assets measured and recorded at fair value on a recurring
basis, using significant unobservable inputs (Level 3) (in millions):
Level 3
Balance at January 1, 2009 ........................................................... $197
Change in unrealized loss included in other comprehensive income ........................ 12
Net settlements ..................................................................... (27)
Balance at December 31, 2009 ........................................................ 182
Change in unrealized loss included in other comprehensive income ........................ 4
Net settlements ..................................................................... (33)
Balance at December 31, 2010 ........................................................ 153
Change in unrealized loss included in other comprehensive income ........................ (3)
Net settlements ..................................................................... (32)
Balance at December 31, 2011 ......................................................... $118
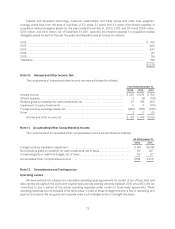
Note 7. Property and Equipment
Property and equipment consisted of the following (in millions):
As of
December 31,
2010
As of
December 31,
2011
Information technology assets ................................................ $4,670 $ 6,060
Land and buildings .......................................................... 3,969 5,228
Construction in progress ..................................................... 2,329 2,128
Leasehold improvements .................................................... 738 919
Furniture and fixtures ........................................................ 65 65
Total .................................................................. 11,771 14,400
Less: accumulated depreciation and amortization ............................... 4,012 4,797
Property and equipment, net .................................................. $7,759 $ 9,603
71