Energizer 2015 Annual Report Download - page 83
Download and view the complete annual report
Please find page 83 of the 2015 Energizer annual report below. You can navigate through the pages in the report by either clicking on the pages listed below, or by using the keyword search tool below to find specific information within the annual report.-
 1
1 -
2
-
3
-
4
-
5
-
6
-
7
-
8
-
9
-
10
-
11
-
12
-
13
-
14
-
15
-
16
-
17
-
18
-
19
-
20
-
21
-
22
-
23
-
24
-
25
-
26
-
27
-
28
-
29
-
30
-
31
-
32
-
33
-
34
-
35
-
36
-
37
-
38
-
39
-
40
-
41
-
42
-
43
-
44
-
45
-
46
-
47
-
48
-
49
-
50
-
51
-
52
-
53
-
54
-
55
-
56
-
57
-
58
-
59
-
60
-
61
-
62
-
63
-
64
-
65
-
66
-
67
-
68
-
69
-
70
-
71
-
72
-
 73
73 -
 74
74 -
 75
75 -
 76
76 -
 77
77 -
 78
78 -
 79
79 -
 80
80 -
 81
81 -
 82
82 -
 83
83 -
 84
84 -
 85
85 -
 86
86 -
 87
87 -
 88
88 -
 89
89 -
 90
90 -
 91
91 -
 92
92 -
 93
93 -
94
-
95
-
96
-
97
-
98
-
99
 |
 |

ENERGIZER HOLDINGS, INC.
NOTES TO CONSOLIDATED FINANCIAL STATEMENTS
(Dollars in millions, except per share)
79
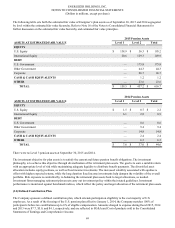
Total Assets 2015 2014
North America $ 394.8 $ 371.7
Latin America 63.3 58.6
EMEA 237.5 188.3
Asia Pacific 573.2 329.6
Total segment assets $ 1,268.8 $ 948.2
Corporate 246.4 129.3
Goodwill and other intangible assets, net 114.4 117.2
Total assets $ 1,629.6 $ 1,194.7
Capital Expenditures 2015 2014 2013
North America $ 28.4 $ 15.9 $ 5.7
Latin America 1.2 0.6 2.2
EMEA 2.3 1.9 1.5
Asia Pacific 8.5 10.0 8.4
Total segment capital expenditures $ 40.4 $ 28.4 $ 17.8
(1) Includes $0.3 for the twelve months ended September 30, 2015, $5.9 for the twelve months ended September 30, 2014 and $6.1 for the
twelve months ended September 30, 2013 associated with certain information technology and related activities, which are included in SG&A
on the Consolidated Statements of Earnings and Comprehensive Income. Additionally, pre-tax costs of $3.1 for the twelve months ended
September 30, 2015, $1.0 for the twelve months ended September 30, 2014 and $2.6 for the twelve months ended September 30, 2013
associated with obsolescence charges and severance related to our restructuring, were included in Cost of products sold on the
Consolidated Statements of Earnings and Comprehensive Income.
(2) Includes $0.3 recorded in cost of products sold and $1.3 recorded in SG&A in the Consolidated Statements of Earnings and Comprehensive
Income.
(3) Included in SG&A in the Consolidated Statements of Earnings and Comprehensive Income.
(4) Included in Interest Expense in the Consolidated Statements of Earnings and Comprehensive Income.
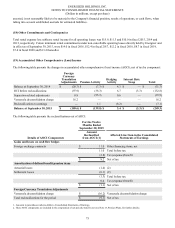
Geographic segment information for the years ended September 30 was as follows:
2015 2014 2013
Net Sales to Customers
United States $ 767.6 $ 822.0 $ 951.2
International 864.0 1,018.4 1,061.0
Total net sales $ 1,631.6 $ 1,840.4 $ 2,012.2
Long-Lived Assets
United States $ 210.9 $ 95.3
Singapore 69.7 81.9
Other International 108.1 153.2
Total long-lived assets excluding goodwill and intangibles $ 388.7 $ 330.4