Energizer 2015 Annual Report Download - page 82
Download and view the complete annual report
Please find page 82 of the 2015 Energizer annual report below. You can navigate through the pages in the report by either clicking on the pages listed below, or by using the keyword search tool below to find specific information within the annual report.-
 1
1 -
2
-
3
-
4
-
5
-
6
-
7
-
8
-
9
-
10
-
11
-
12
-
13
-
14
-
15
-
16
-
17
-
18
-
19
-
20
-
21
-
22
-
23
-
24
-
25
-
26
-
27
-
28
-
29
-
30
-
31
-
32
-
33
-
34
-
35
-
36
-
37
-
38
-
39
-
40
-
41
-
42
-
43
-
44
-
45
-
46
-
47
-
48
-
49
-
50
-
51
-
52
-
53
-
54
-
55
-
56
-
57
-
58
-
59
-
60
-
61
-
62
-
63
-
64
-
65
-
66
-
67
-
68
-
69
-
70
-
71
-
 72
72 -
 73
73 -
 74
74 -
 75
75 -
 76
76 -
 77
77 -
 78
78 -
 79
79 -
 80
80 -
 81
81 -
 82
82 -
 83
83 -
 84
84 -
 85
85 -
 86
86 -
 87
87 -
 88
88 -
 89
89 -
 90
90 -
 91
91 -
 92
92 -
93
-
94
-
95
-
96
-
97
-
98
-
99
 |
 |

ENERGIZER HOLDINGS, INC.
NOTES TO CONSOLIDATED FINANCIAL STATEMENTS
(Dollars in millions, except per share)
78
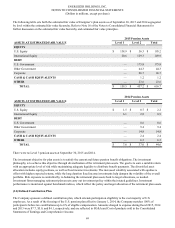
(21) Segments
Operations for Energizer are managed via four major geographic reportable segments: North America (the United States and
Canada), Latin America, Europe, Middle East and Africa (“EMEA”), and Asia Pacific.
Energizer’s operating model includes a combination of standalone and shared business functions between the geographic
segments, varying by country and region of the world. Shared functions include IT and finance shared service costs. Energizer
applies a fully allocated cost basis, in which shared business functions are allocated between segments. Such allocations are
estimates, and do not represent the costs of such services if performed on a standalone basis.
For the year ended September 30, 2015, Edgewell recorded a one-time charge of $144.5 as a result of deconsolidating its
Venezuelan subsidiaries, which had no accompanying tax benefit. Energizer was allocated $65.2 of this one-time charge. See
Note 6, Venezuela, to the Consolidated Financial Statements.
Corporate assets shown in the following table include all cash, financial instruments and deferred tax assets that are managed
outside of operating segments.
Net Sales 2015 2014 2013
North America $ 831.3 $ 909.2 $ 1,041.9
Latin America 125.1 162.1 182.0
EMEA 370.4 419.1 423.3
Asia Pacific 304.8 350.0 365.0
Total net sales $ 1,631.6 $ 1,840.4 $ 2,012.2
Segment Profit
North America 234.6 263.9 307.1
Latin America 20.7 26.4 32.9
EMEA 58.3 61.4 49.9
Asia Pacific 77.9 97.1 98.2
Total segment profit $ 391.5 $ 448.8 $ 488.1
General corporate and other expenses (66.0)(62.5)(70.8)
Global marketing expenses (24.8)(20.7)(21.8)
Research and development expense (24.9)(25.3)(29.7)
Venezuela deconsolidation charge (65.2)— —
Restructuring (1) (13.0)(50.4)(132.6)
Integration (2) (1.6)— —
Spin costs (3) (98.1)(21.3) —
Spin restructuring (39.1)— —
Cost of early debt retirement (4) (26.7)— —
Interest and other financing items (32.8)(53.4)(71.2)
Total (loss) earnings before income taxes $(0.7)$ 215.2 $ 162.0
Depreciation and Amortization
North America 22.3 17.6 25.1
Latin America 1.0 0.1 0.7
EMEA 1.1 0.6 1.4
Asia Pacific 12.8 20.9 26.2
Total segment depreciation and amortization 37.2 39.2 53.4
Corporate 4.6 3.0 2.5
Total depreciation and amortization $ 41.8 $ 42.2 $ 55.9