Energizer 2015 Annual Report Download - page 54
Download and view the complete annual report
Please find page 54 of the 2015 Energizer annual report below. You can navigate through the pages in the report by either clicking on the pages listed below, or by using the keyword search tool below to find specific information within the annual report.-
 1
1 -
2
-
3
-
4
-
5
-
6
-
7
-
8
-
9
-
10
-
11
-
12
-
13
-
14
-
15
-
16
-
17
-
18
-
19
-
20
-
21
-
22
-
23
-
24
-
25
-
26
-
27
-
28
-
29
-
30
-
31
-
32
-
33
-
34
-
35
-
36
-
37
-
38
-
39
-
40
-
41
-
42
-
43
-
 44
44 -
 45
45 -
 46
46 -
 47
47 -
 48
48 -
 49
49 -
 50
50 -
 51
51 -
 52
52 -
 53
53 -
 54
54 -
 55
55 -
 56
56 -
 57
57 -
 58
58 -
 59
59 -
 60
60 -
 61
61 -
 62
62 -
 63
63 -
 64
64 -
65
-
66
-
67
-
68
-
69
-
70
-
71
-
72
-
73
-
74
-
75
-
76
-
77
-
78
-
79
-
80
-
81
-
82
-
83
-
84
-
85
-
86
-
87
-
88
-
89
-
90
-
91
-
92
-
93
-
94
-
95
-
96
-
97
-
98
-
99
 |
 |

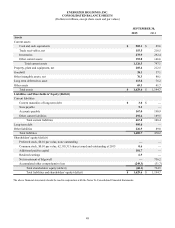
50
ENERGIZER HOLDINGS, INC.
CONSOLIDATED STATEMENTS OF SHAREHOLDERS' EQUITY/(DEFICIT)
(Dollars in millions, shares in thousands)
September 30, 2015
Shares Common
Stock
Additional
Paid-in
Capital Retained
Earnings
Net
Investment
of
Edgewell
Accumulated
Other
Comprehensive
(Loss)/Income
Total
Shareholders'
Equity/
(Deficit)
Balance, September 30, 2012 — $ — $ — $ — $ 964.0 $ (29.4) $ 934.6
Net earnings — — — — 114.9 — 114.9
Other comprehensive income — — — — — (5.2) (5.2)
Net decrease in Edgewell investment — — — — (306.6) — (306.6)
Balance, September 30, 2013 — — — — 772.3 (34.6) 737.7
Net earnings — — — — 157.3 — 157.3
Other comprehensive income — — — — — 2.9 2.9
Net decrease in Edgewell investment — — — — (173.4) — (173.4)
Balance, September 30, 2014 — — — — 756.2 (31.7) 724.5
Net earnings/(loss) — — — 23.1 (27.1) — (4.0)
Net decrease in Edgewell investment — — — — (946.6) (946.6)
Separation related adjustments — — — — 393.5 (93.9) 299.6
Reclassification of net investment to
additional paid-in capital — — 176.0 — (176.0) — —
Issuance of common stock at spin-off 62,193 0.6 (0.6) — — — —
Share based expense — — 6.3 — — — 6.3
Activity under stock plans 2 — — — — — —
Dividends to shareholders — — — (16.2) — — (16.2)
Other comprehensive loss — — — — — (123.7)(123.7)
Balance, September 30, 2015 62,195 $ 0.6 $ 181.7 $ 6.9 $ — $ (249.3) $ (60.1)
The above financial statements should be read in conjunction with the Notes To Consolidated Financial Statements.