Energizer 2015 Annual Report Download - page 37
Download and view the complete annual report
Please find page 37 of the 2015 Energizer annual report below. You can navigate through the pages in the report by either clicking on the pages listed below, or by using the keyword search tool below to find specific information within the annual report.-
 1
1 -
2
-
3
-
4
-
5
-
6
-
7
-
8
-
9
-
10
-
11
-
12
-
13
-
14
-
15
-
16
-
17
-
18
-
19
-
20
-
21
-
22
-
23
-
24
-
25
-
26
-
 27
27 -
 28
28 -
 29
29 -
 30
30 -
 31
31 -
 32
32 -
 33
33 -
 34
34 -
 35
35 -
 36
36 -
 37
37 -
 38
38 -
 39
39 -
 40
40 -
 41
41 -
 42
42 -
 43
43 -
 44
44 -
 45
45 -
 46
46 -
 47
47 -
48
-
49
-
50
-
51
-
52
-
53
-
54
-
55
-
56
-
57
-
58
-
59
-
60
-
61
-
62
-
63
-
64
-
65
-
66
-
67
-
68
-
69
-
70
-
71
-
72
-
73
-
74
-
75
-
76
-
77
-
78
-
79
-
80
-
81
-
82
-
83
-
84
-
85
-
86
-
87
-
88
-
89
-
90
-
91
-
92
-
93
-
94
-
95
-
96
-
97
-
98
-
99
 |
 |

33
items determined to be corporate in nature. Financial items, such as interest income and expense, are managed on a global
basis at the corporate level. The exclusion of substantially all restructuring and realignment costs from segment results
reflects management’s view on how it evaluates segment performance.
Energizer’s operating model includes a combination of standalone and shared business functions between the
geographic segments, varying by country and region of the world. Shared functions include IT and finance shared service
costs. Energizer applies a fully allocated cost basis, in which shared business functions are allocated between the
segments. Such allocations are estimates, and do not represent the costs of such services if performed on a standalone
basis. This structure is the basis for Energizer’s reportable operating segment information, as included in the tables in Note
21, Segments, to the Consolidated Financial Statements.
Net Sales
For the years ended September 30,
2015 % Chg 2014 % Chg 2013
North America
Net sales - prior year $ 909.2 $ 1,041.9 $ 1,103.4
Organic (69.8)(7.7)% (127.2) (12.2)% (61.0)
Impact of currency (8.1)(0.9)% (5.5) (0.5)% (0.5)
Net sales - current year $ 831.3 (8.6)% $ 909.2 (12.7)% $ 1,041.9
Latin America
Net sales - prior year $ 162.1 $ 182.0 $ 183.1
Organic 0.4 0.3 % (1.6) (0.8)% 7.4
International Go-to-Market (4.3)(2.7)% — — % —
Change in Venezuela results (17.3)(10.7)% — — % —
Impact of currency (15.8)(9.7)% (18.3) (10.1)% (8.5)
Net sales - current year $ 125.1 (22.8)% $ 162.1 (10.9)% $ 182.0
EMEA
Net sales - prior year $ 419.1 $ 423.3 $ 431.6
Organic 9.7 2.3 % (5.6) (1.3)% (2.9)
International Go-to-Market 1.3 0.3 % — — % —
Impact of currency (59.7)(14.2)% 1.4 0.3 % (5.4)
Net sales - current year $ 370.4 (11.6)% $ 419.1 (1.0)% $ 423.3
Asia Pacific
Net sales - prior year $ 350.0 $ 365.0 $ 369.6
Organic (5.7)(1.6)% (2.5) (0.7)% (3.0)
International Go-to-Market (13.4)(3.8)% — — % —
Impact of currency (26.1)(7.5)% (12.5) (3.4)% (1.6)
Net sales - current year $ 304.8 (12.9)% $ 350.0 (4.1)% $ 365.0
Total Net Sales
Net sales - prior year $ 1,840.4 $ 2,012.2 $ 2,087.7
Organic (65.4)(3.6)% (136.9) (6.8)% (59.5)
International Go-to-Market (16.4)(0.9)% — — % —
Change in Venezuela results (17.3)(0.9)% — — % —
Impact of currency (109.7)(5.9)% (34.9) (1.7)% (16.0)
Net sales - current year $ 1,631.6 (11.3)% $ 1,840.4 (8.5)% $ 2,012.2
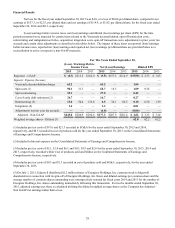
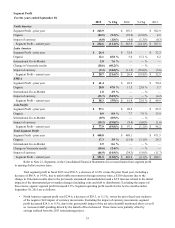
Total net sales for the twelve months ended September 30, 2015 decreased 11.3%, including a decrease of $109.7
due to unfavorable movement in foreign currency rates, a $17.3 change in Venezuela results (as a result of Edgewell's
previously announced deconsolidation) and $16.4 related to the initial impacts of the international go-to-market changes