Energizer 2015 Annual Report Download - page 61
Download and view the complete annual report
Please find page 61 of the 2015 Energizer annual report below. You can navigate through the pages in the report by either clicking on the pages listed below, or by using the keyword search tool below to find specific information within the annual report.-
 1
1 -
2
-
3
-
4
-
5
-
6
-
7
-
8
-
9
-
10
-
11
-
12
-
13
-
14
-
15
-
16
-
17
-
18
-
19
-
20
-
21
-
22
-
23
-
24
-
25
-
26
-
27
-
28
-
29
-
30
-
31
-
32
-
33
-
34
-
35
-
36
-
37
-
38
-
39
-
40
-
41
-
42
-
43
-
44
-
45
-
46
-
47
-
48
-
49
-
50
-
 51
51 -
 52
52 -
 53
53 -
 54
54 -
 55
55 -
 56
56 -
 57
57 -
 58
58 -
 59
59 -
 60
60 -
 61
61 -
 62
62 -
 63
63 -
 64
64 -
 65
65 -
 66
66 -
 67
67 -
 68
68 -
 69
69 -
 70
70 -
 71
71 -
72
-
73
-
74
-
75
-
76
-
77
-
78
-
79
-
80
-
81
-
82
-
83
-
84
-
85
-
86
-
87
-
88
-
89
-
90
-
91
-
92
-
93
-
94
-
95
-
96
-
97
-
98
-
99
 |
 |

ENERGIZER HOLDINGS, INC.
NOTES TO CONSOLIDATED FINANCIAL STATEMENTS
(Dollars in millions, except per share)
57
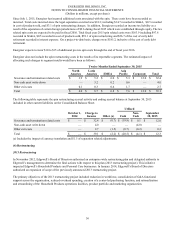
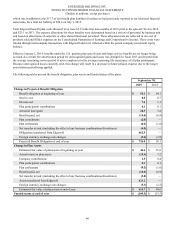
For the twelve months ended September 30, 2015, significant progress has been made against all of the aforementioned
objectives. The pre-tax expense for charges related to the 2013 restructuring project attributed to Energizer for the years
indicated:
Twelve Months Ended September 30, 2015
North
America Latin
America EMEA Asia
Pacific Corporate Total
Severance and related benefit costs $ (0.2) $ 0.3 $ 0.5 $ 6.6 $ (0.2) $ 7.0
Accelerated depreciation — — — 9.1 — 9.1
Consulting, program management and other
exit costs 2.2 0.1 0.3 1.9 — 4.5
Net gain on asset sale — — — (11.0) — (11.0)
Total $ 2.0 $ 0.4 $ 0.8 $ 6.6 $ (0.2) $ 9.6
Twelve Months Ended September 30, 2014
North
America Latin
America EMEA Asia
Pacific Corporate Total
Severance and related benefit costs $ 4.3 $ 1.4 $ 2.1 $ 2.1 $ 1.6 $ 11.5
Accelerated depreciation 4.1 — — — — 4.1
Consulting, program management and other
exit costs 17.3 1.4 3.1 3.7 — 25.5
Net loss on asset sale 2.4 — — — — 2.4
Total $ 28.1 $ 2.8 $ 5.2 $ 5.8 $ 1.6 $ 43.5
Twelve Months Ended September 30, 2013
North
America Latin
America EMEA Asia
Pacific Corporate Total
Severance and related benefit costs $ 27.6 $ 1.8 $ 5.5 $ 3.4 $ 4.9 $ 43.2
Non-cash asset impairment charges 19.3 — — — — 19.3
Accelerated depreciation 23.6 — — — — 23.6
Consulting, program management and other
exit costs 25.6 2.1 4.6 5.5 — 37.8
Total $ 96.1 $ 3.9 $ 10.1 $ 8.9 $ 4.9 $ 123.9
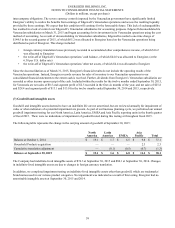
Total pre-tax restructuring charges since the inception of the project and through September 30, 2015, have totaled
approximately $200. For the twelve months ended September 30, 2015, Energizer recorded $9.6 in pre-tax restructuring charges
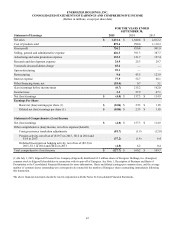
related to the 2013 restructuring project as compared to $43.5 and $123.9 in fiscal 2014 and 2013, respectively. Restructuring
charges were reflected on a separate line in the Consolidated Statements of Earnings and Comprehensive Income. In addition,
pre-tax costs of $1.1, $1.0 and $6.1 associated with certain inventory obsolescence charges were recorded within Cost of
products sold and $0.3, $5.9 and $2.6 associated with information technology enablement activities were recorded within
SG&A on the Consolidated Statements of Earnings and Comprehensive Income for the twelve months ended September 30,
2015, 2014, and 2013, respectively. These inventory obsolescence and information technology costs are considered part of the
total project costs incurred for 2013 the restructuring project.
The 2013 restructuring project was concluded in fiscal 2015 and we do not expect the remaining costs for Energizer to be
material.