Energizer 2015 Annual Report Download - page 72
Download and view the complete annual report
Please find page 72 of the 2015 Energizer annual report below. You can navigate through the pages in the report by either clicking on the pages listed below, or by using the keyword search tool below to find specific information within the annual report.-
 1
1 -
2
-
3
-
4
-
5
-
6
-
7
-
8
-
9
-
10
-
11
-
12
-
13
-
14
-
15
-
16
-
17
-
18
-
19
-
20
-
21
-
22
-
23
-
24
-
25
-
26
-
27
-
28
-
29
-
30
-
31
-
32
-
33
-
34
-
35
-
36
-
37
-
38
-
39
-
40
-
41
-
42
-
43
-
44
-
45
-
46
-
47
-
48
-
49
-
50
-
51
-
52
-
53
-
54
-
55
-
56
-
57
-
58
-
59
-
60
-
61
-
 62
62 -
 63
63 -
 64
64 -
 65
65 -
 66
66 -
 67
67 -
 68
68 -
 69
69 -
 70
70 -
 71
71 -
 72
72 -
 73
73 -
 74
74 -
 75
75 -
 76
76 -
 77
77 -
 78
78 -
 79
79 -
 80
80 -
 81
81 -
 82
82 -
83
-
84
-
85
-
86
-
87
-
88
-
89
-
90
-
91
-
92
-
93
-
94
-
95
-
96
-
97
-
98
-
99
 |
 |

ENERGIZER HOLDINGS, INC.
NOTES TO CONSOLIDATED FINANCIAL STATEMENTS
(Dollars in millions, except per share)
68
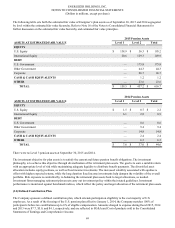
achieve that goal. The U.S. plan's assets are currently invested in several funds representing most standard equity and debt
security classes. The broad target allocations are approximately: (a) equities, including U.S. and foreign: 65%, and (b) debt
securities, including U.S. bonds: 35%. Actual allocations at September 30, 2015 approximated these targets. The U.S. plan held
no shares of Company common stock at September 30, 2015. Investment objectives are similar for non-U.S. pension
arrangements, subject to local requirements.
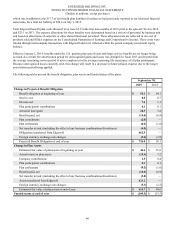
The following table presents plan pension expense:
For the Years Ended September 30,
Pension
2015 2014 2013
Service cost $ 0.8 $ 0.7 $ 1.1
Interest cost 7.6 1.3 1.2
Expected return on plan assets (12.2)(1.8)(1.8)
Recognized net actuarial loss/(gain) 1.4 0.1 0.4
Settlement loss recognized 0.1 0.2 0.1
Net periodic benefit cost $(2.3)$ 0.5 $ 1.0
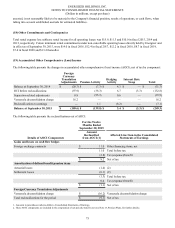
Amounts expected to be amortized from accumulated other comprehensive loss into net period benefit cost during the year
ending September 30, 2016 are net actuarial losses of $6.9.
The following table presents assumptions, which reflect weighted averages for the component plans, used in determining the
above information:
September 30,
2015 2014
Plan obligations:
Discount rate 3.9% 1.5%
Compensation increase rate 3.3% 2.3%
Net periodic benefit cost:
Discount rate 4.0% 2.1%
Expected long-term rate of return on plan assets 7.0% 3.5%
Compensation increase rate 3.3% 2.3%
The change in our assumptions from fiscal 2014 to fiscal 2015 is due to the change in the composition in plans now that the
Company has assumed the full pension plan liabilities from Edgewell as discussed above. The expected return on the plan
assets was determined based on historical and expected future returns of the various asset classes, using the target allocations
described above.