Energizer 2015 Annual Report Download - page 2
Download and view the complete annual report
Please find page 2 of the 2015 Energizer annual report below. You can navigate through the pages in the report by either clicking on the pages listed below, or by using the keyword search tool below to find specific information within the annual report.
Energizer Holdings, Inc. is one of the world’s largest manufacturers of primary
batteries and portable lighting products and is anchored by its two globally recognized
brands Energizer® and EVEREADY®. As a global leader in power solutions, our mission
is to lead the charge to connect our brands, our people and the products we offer to
the world better than anyone else. Energizer Holdings, Inc. is traded on the NYSE
under the ticker symbol ENR.
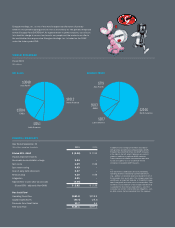
FINANCIAL HIGHLIGHTS
NET SALES SEGMENT PROFIT
2015 2014
Diluted EPS - GAAP $ (0.06) $ 2.53
Impacts Expense (Income)
Venezuela deconsolidation charge 1.04 –
Spin costs 1.09 0.26
Spin restructuring 0.43 –
Cost of early debt retirement 0.27 –
Restructuring 0.10 0.56
Integration 0.01 –
Adjustments to prior year tax accruals (0.06) –
Diluted EPS - adjusted (Non-GAAP) $ 2.82 $ 3.35
Free Cash Flow*
Operating Cash Flow $161.8 $219.9
Capital Expenditures (40.4) (28.4)
Proceeds from Asset Sales 13.7 5.6
Free Cash Flow $135.1 $197.1
SEGMENT BREAKDOWN
Fiscal 2015
($ in millions)
$234.6
North America
$831.3
North America
$20.7
Latin America
$125.1
Latin America
$370.4
EMEA
$304.8
Asia Pacic
$58.3
EMEA
$77.9
Asia Pacic
In addition to its earnings presented in accordance
with generally accepted accounting principles (GAAP),
Energizer has presented certain non-GAAP measures
in the table to the left, which it believes are useful to
readers in addition to traditional GAAP measures.
These measures should be considered an alternative
to, but not superior to or as a substitute for, the
company’s comparable GAAP measures.
(*)
Free Cash Flow is dened as net cash provided by
operating activities reduced by capital expenditures,
(e.g., additions to property, plant and equipment) net of
the proceeds from asset sales. The company views free
cashow as an important indicator of its ability to repay
debt, fund growth and return cash to shareholders. Free
cashow is not a measure of the residual cashow that
is available for discretionary expenditures, since the
company has certain nondiscretionary obligations, such
as debt service, that are deducted from the measure.
Year Ended September 30
($ in millions, except per share data)


