Energizer 2015 Annual Report Download - page 79
Download and view the complete annual report
Please find page 79 of the 2015 Energizer annual report below. You can navigate through the pages in the report by either clicking on the pages listed below, or by using the keyword search tool below to find specific information within the annual report.-
 1
1 -
2
-
3
-
4
-
5
-
6
-
7
-
8
-
9
-
10
-
11
-
12
-
13
-
14
-
15
-
16
-
17
-
18
-
19
-
20
-
21
-
22
-
23
-
24
-
25
-
26
-
27
-
28
-
29
-
30
-
31
-
32
-
33
-
34
-
35
-
36
-
37
-
38
-
39
-
40
-
41
-
42
-
43
-
44
-
45
-
46
-
47
-
48
-
49
-
50
-
51
-
52
-
53
-
54
-
55
-
56
-
57
-
58
-
59
-
60
-
61
-
62
-
63
-
64
-
65
-
66
-
67
-
68
-
 69
69 -
 70
70 -
 71
71 -
 72
72 -
 73
73 -
 74
74 -
 75
75 -
 76
76 -
 77
77 -
 78
78 -
 79
79 -
 80
80 -
 81
81 -
 82
82 -
 83
83 -
 84
84 -
 85
85 -
 86
86 -
 87
87 -
 88
88 -
 89
89 -
90
-
91
-
92
-
93
-
94
-
95
-
96
-
97
-
98
-
99
 |
 |
ENERGIZER HOLDINGS, INC.
NOTES TO CONSOLIDATED FINANCIAL STATEMENTS
(Dollars in millions, except per share)
75
asserted, is not reasonably likely to be material to the Company's financial position, results of operations, or cash flows, when
taking into account established accruals for estimated liabilities.
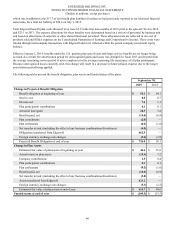
(18) Other Commitments and Contingencies
Total rental expense less sublease rental income for all operating leases was $15.9, $11.3 and $10.0 in fiscal 2015, 2014 and
2013, respectively. Future minimum rental commitments under non-cancellable operating leases directly held by Energizer and
in effect as of September 30, 2015, were $14.0 in fiscal 2016, $12.4 in fiscal 2017, $12.2 in fiscal 2018, $8.7 in fiscal 2019,
$7.4 in fiscal 2020 and $13.2 thereafter.
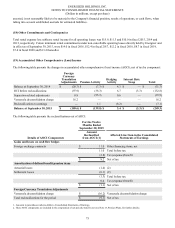
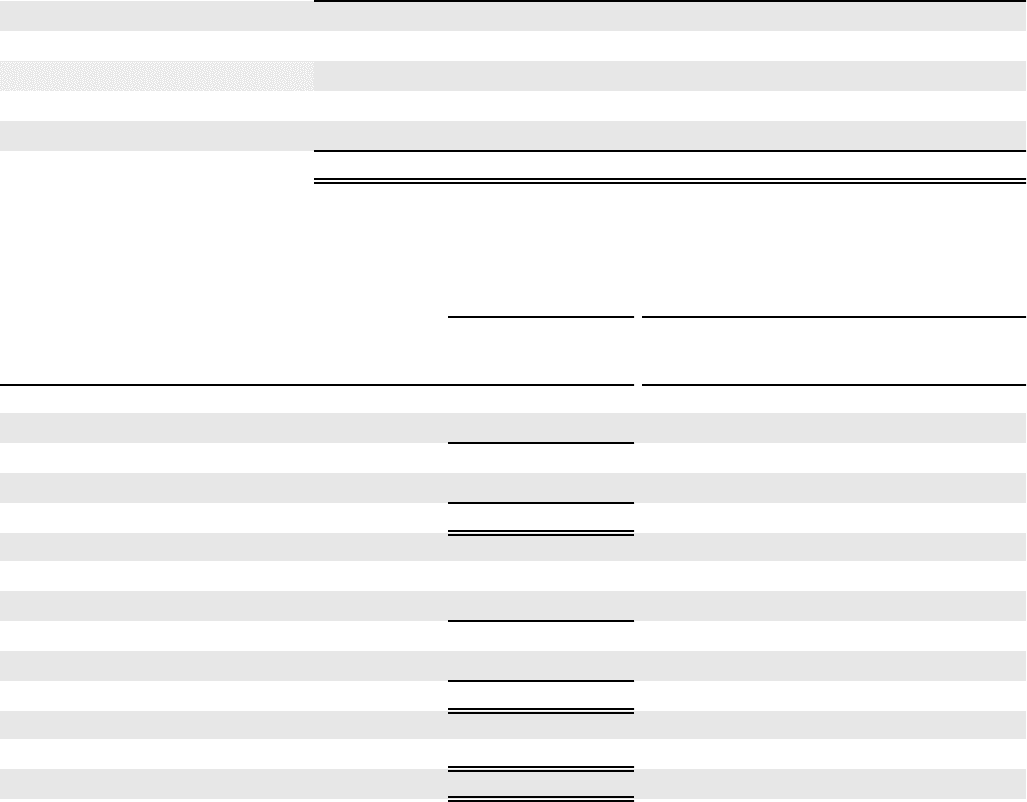
(19) Accumulated Other Comprehensive (Loss)/Income
The following table presents the changes in accumulated other comprehensive (loss)/income (AOCI), net of tax by component:
Foreign
Currency
Translation
Adjustments Pension Activity Hedging
Activity Interest Rate
Swap Total
Balance at September 30, 2014 $ (28.7) $ (7.3) $ 4.3 $ — $ (31.7)
OCI before reclassifications (97.9) (38.3) 6.7 (3.3)(132.8)
Separation related adjustments 0.8 (95.3) 0.6 — (93.9)
Venezuela deconsolidation charge 16.2 — — — 16.2
Reclassifications to earnings — 1.1 (8.2) — (7.1)
Balance at September 30, 2015 $ (109.6) $ (139.8) $ 3.4 $ (3.3) $ (249.3)
The following table presents the reclassifications out of AOCI:
For the Twelve
Months Ended
September 30, 2015
Details of AOCI Components
Amount
Reclassified
from AOCI (1) Affected Line Item in the Consolidated
Statements of Earnings
Gains and losses on cash flow hedges
Foreign exchange contracts $ 11.0 Other financing items, net
11.0 Total before tax
(2.8) Tax (expense)/benefit
$ 8.2 Net of tax
Amortization of defined benefit pension items
Actuarial losses (1.4) (2)
Settlement losses (0.1) (2)
(1.5) Total before tax
0.4 Tax (expense)/benefit
$(1.1) Net of tax
Foreign Currency Translation Adjustments
Venezuela deconsolidation charge $ (16.2) Venezuela deconsolidation charge
Total reclassifications for the period $ (9.1) Net of tax
1. Amounts in parentheses indicate debits to Consolidated Statements of Earnings.
2. These AOCI components are included in the computation of net periodic benefit cost (see Note 13, Pension Plans, for further details).