Energizer 2015 Annual Report Download - page 40
Download and view the complete annual report
Please find page 40 of the 2015 Energizer annual report below. You can navigate through the pages in the report by either clicking on the pages listed below, or by using the keyword search tool below to find specific information within the annual report.-
 1
1 -
2
-
3
-
4
-
5
-
6
-
7
-
8
-
9
-
10
-
11
-
12
-
13
-
14
-
15
-
16
-
17
-
18
-
19
-
20
-
21
-
22
-
23
-
24
-
25
-
26
-
27
-
28
-
29
-
 30
30 -
 31
31 -
 32
32 -
 33
33 -
 34
34 -
 35
35 -
 36
36 -
 37
37 -
 38
38 -
 39
39 -
 40
40 -
 41
41 -
 42
42 -
 43
43 -
 44
44 -
 45
45 -
 46
46 -
 47
47 -
 48
48 -
 49
49 -
 50
50 -
51
-
52
-
53
-
54
-
55
-
56
-
57
-
58
-
59
-
60
-
61
-
62
-
63
-
64
-
65
-
66
-
67
-
68
-
69
-
70
-
71
-
72
-
73
-
74
-
75
-
76
-
77
-
78
-
79
-
80
-
81
-
82
-
83
-
84
-
85
-
86
-
87
-
88
-
89
-
90
-
91
-
92
-
93
-
94
-
95
-
96
-
97
-
98
-
99
 |
 |

36
• Latin America segment profit was $20.7, a decrease of $5.7, or 21.6%, versus the prior fiscal year inclusive of the
negative impact of currency movements. The change in Venezuela (as a result of the deconsolidation) accounted
for $10.6, or 40.2%, decrease in segment profit. The go-to-market changes positively contributed $2.0, or 7.6%,
to segment profit as the loss of sales was more than offset by a reduction in overhead costs. Excluding these
items, organic segment profit increased $12.1, or 45.8%, due to a reduction in spending and favorable product
costs as a result of savings realized from the 2013 restructuring project.
• EMEA segment profit was $58.3, a decrease of $3.1, or 5.0%, versus the prior fiscal year. Excluding $33.7 of
unfavorable currency impacts and positive go-to-market changes of $1.8, organic segment profit increased $28.8,
or 47.0%, due primarily to savings realized from the 2013 restructuring project and favorability due to
manufacturing footprint changes. These savings enhanced the profitability of the sales increase mentioned above.
• Asia Pacific segment profit was $77.9, a decrease of $19.2, or 19.8%, versus the prior fiscal year inclusive of the
negative impact of currency movements of $19.2 and a decrease from go-to-market changes of $0.9. Excluding
the impact of these items, segment profit increased $0.9, or 0.9%, as topline shortfalls were more than offset by
lower A&P spending and savings from the 2013 restructuring project.
Segment profit in fiscal 2014 was $448.8, a decrease of $39.3, or 8.1%, versus the prior fiscal year.
• North America segment profit was $263.9, a decrease of $43.2, or 14.1%, versus the prior fiscal year inclusive of the
negative impact of currency movements. Excluding the impact of currency movements, segment profit decreased
$39.2, or 12.8%, due to the gross profit impact of the net sales shortfall mentioned above which was partially offset by
restructuring savings.
• Latin America segment profit was $26.4, a decrease of $6.5, or 19.8%, versus the prior fiscal year inclusive of the
negative impact of currency movements of $11.5. Excluding the impact of currency movements, segment profit
increased $5.0, or 15.2%, due to favorable product costs as a result of savings realized from the 2013 restructuring
project.
• EMEA segment profit was $61.4, an increase of $11.5, or 23.0%, versus the prior fiscal year due primarily to savings
realized from the 2013 restructuring project. These savings were able to offset the gross profit impact of the net sales
shortfall mentioned above.
• Asia Pacific segment profit was $97.1, a decrease of $1.1, or 1.1%, versus the prior fiscal year inclusive of the
negative impact of currency movements of $8.8. Excluding the impact of currency movements, segment profit
increased $7.7, or 7.9%, due to savings realized from the 2013 restructuring project. These savings were able to offset
the gross profit impact of the net sales shortfall mentioned above.
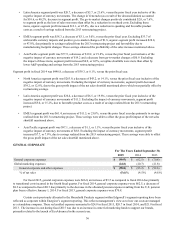
GENERAL CORPORATE
For The Years Ended September 30,
2015 2014 2013
General corporate expenses $(66.0)$ (62.5) $ (70.8)
Global marketing expenses (24.8)(20.7) (21.8)
General corporate and other expenses $(90.8)$ (83.2) $ (92.6)
% of net sales (5.6)% (4.5)% (4.6)%
For fiscal 2015, general corporate expenses were $66.0, an increase of $3.5 as compared to fiscal 2014 due primarily
to transitional costs incurred in the fourth fiscal quarter. For fiscal 2014, general corporate expenses were $62.5, a decrease of
$8.3 as compared to fiscal 2013 due primarily to the decrease in the allocated pension expense resulting from the U.S. pension
plan freeze effective January 1, 2014. For fiscal 2013, general corporate expenses were $70.8.
Certain costs previously allocated to the Household Products segment within Edgewell’s segment reporting have been
reflected as corporate within Energizer’s segment reporting. This reflects management’s view as to how our costs are managed
as a standalone company. These reclassified expenses amounted to $24.8 in fiscal 2015, $20.7 in fiscal 2014, and $21.8 in fiscal
2013. The increase in cost during fiscal 2015 was due to an increase in center led marketing funds to support our brands,
primarily related to the launch of EcoAdvanced in the current year.