Energizer 2015 Annual Report Download - page 53
Download and view the complete annual report
Please find page 53 of the 2015 Energizer annual report below. You can navigate through the pages in the report by either clicking on the pages listed below, or by using the keyword search tool below to find specific information within the annual report.-
 1
1 -
2
-
3
-
4
-
5
-
6
-
7
-
8
-
9
-
10
-
11
-
12
-
13
-
14
-
15
-
16
-
17
-
18
-
19
-
20
-
21
-
22
-
23
-
24
-
25
-
26
-
27
-
28
-
29
-
30
-
31
-
32
-
33
-
34
-
35
-
36
-
37
-
38
-
39
-
40
-
41
-
42
-
 43
43 -
 44
44 -
 45
45 -
 46
46 -
 47
47 -
 48
48 -
 49
49 -
 50
50 -
 51
51 -
 52
52 -
 53
53 -
 54
54 -
 55
55 -
 56
56 -
 57
57 -
 58
58 -
 59
59 -
 60
60 -
 61
61 -
 62
62 -
 63
63 -
64
-
65
-
66
-
67
-
68
-
69
-
70
-
71
-
72
-
73
-
74
-
75
-
76
-
77
-
78
-
79
-
80
-
81
-
82
-
83
-
84
-
85
-
86
-
87
-
88
-
89
-
90
-
91
-
92
-
93
-
94
-
95
-
96
-
97
-
98
-
99
 |
 |

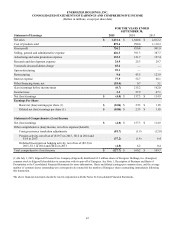
49
ENERGIZER HOLDINGS, INC.
CONSOLIDATED STATEMENTS OF CASH FLOWS
(Dollars in millions)
FOR THE YEARS ENDED
SEPTEMBER 30,
2015 2014 2013
Cash Flow from Operating Activities
Net (loss)/earnings $(4.0)$ 157.3 $ 114.9
Adjustments to reconcile net (loss)/earnings to net cash flow from operations:
Non-cash restructuring costs 13.1 4.1 42.9
Depreciation and amortization 41.8 42.2 55.9
Venezuela deconsolidation charge 65.2 — —
Deferred income taxes (7.1)5.6 (12.8)
Share based compensation 13.5 13.2 16.0
Non-cash items in income, net (13.0)16.1 12.1
Other, net (9.4)(16.1)(56.1)
Changes in assets and liabilities used in operations
Decrease/(Increase) in trade receivables, net 9.7 (13.5) 119.6
(Increase)/Decrease in inventories (0.1)35.5 5.0
Decrease/(Increase) in other current assets 3.5 (10.0)(26.5)
(Decrease)/Increase in accounts payable (18.2)10.7 12.3
Increase/(Decrease) in other current liabilities 66.8 (25.2) 46.3
Net cash flow from operating activities 161.8 219.9 329.6
Cash Flow from Investing Activities
Capital expenditures (40.4)(28.4)(17.8)
Proceeds from sale of assets 13.7 5.6 1.0
Acquisitions, net of cash acquired (12.1)— —
Net cash used by investing activities (38.8)(22.8)(16.8)
Cash Flow from Financing Activities
Net transfers to Edgewell (648.8)(185.5)(301.2)
Cash Proceeds from issuance of debt with original maturities greater than 90
days 999.0 — —
Payments on debt with maturities greater than 90 days (1.0)— —
Decrease in debt with maturities 90 days or less (12.4)— —
Dividend Paid (15.5)— —
Debt issuance costs (12.1)— —
Net cash from/(used by) financing activities 309.2 (185.5)(301.2)
Effect of exchange rate changes on cash (19.7)—(0.3)
Net increase in cash and cash equivalents 412.5 11.6 11.3
Cash and cash equivalents, beginning of period 89.6 78.0 66.7
Cash and cash equivalents, end of period $ 502.1 $ 89.6 $ 78.0
The above financial statements should be read in conjunction with the Notes To Consolidated Financial Statements.