Energizer 2015 Annual Report Download - page 39
Download and view the complete annual report
Please find page 39 of the 2015 Energizer annual report below. You can navigate through the pages in the report by either clicking on the pages listed below, or by using the keyword search tool below to find specific information within the annual report.-
 1
1 -
2
-
3
-
4
-
5
-
6
-
7
-
8
-
9
-
10
-
11
-
12
-
13
-
14
-
15
-
16
-
17
-
18
-
19
-
20
-
21
-
22
-
23
-
24
-
25
-
26
-
27
-
28
-
 29
29 -
 30
30 -
 31
31 -
 32
32 -
 33
33 -
 34
34 -
 35
35 -
 36
36 -
 37
37 -
 38
38 -
 39
39 -
 40
40 -
 41
41 -
 42
42 -
 43
43 -
 44
44 -
 45
45 -
 46
46 -
 47
47 -
 48
48 -
 49
49 -
50
-
51
-
52
-
53
-
54
-
55
-
56
-
57
-
58
-
59
-
60
-
61
-
62
-
63
-
64
-
65
-
66
-
67
-
68
-
69
-
70
-
71
-
72
-
73
-
74
-
75
-
76
-
77
-
78
-
79
-
80
-
81
-
82
-
83
-
84
-
85
-
86
-
87
-
88
-
89
-
90
-
91
-
92
-
93
-
94
-
95
-
96
-
97
-
98
-
99
 |
 |

35
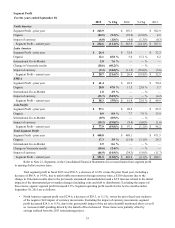
Segment Profit
For the years ended September 30,
2015 % Chg 2014 % Chg 2013
North America
Segment Profit - prior year $ 263.9 $ 307.1 $ 302.9
Organic (24.5)(9.3)% (39.2) (12.8)% 4.5
Impact of currency (4.8)(1.8)% (4.0) (1.3)% (0.3)
Segment Profit - current year $ 234.6 (11.1)% $ 263.9 (14.1)% $ 307.1
Latin America
Segment Profit - prior year $ 26.4 $ 32.9 $ 32.3
Organic 12.1 45.8 % 5.0 15.2 % 6.2
International Go-to-Market 2.0 7.6 % — — % —
Change in Venezuela results (10.6)(40.2)% — — % —
Impact of currency (9.2)(34.8)% (11.5) (35.0)% (5.6)
Segment Profit - current year $ 20.7 (21.6)% $ 26.4 (19.8)% $ 32.9
EMEA
Segment Profit - prior year $ 61.4 $ 49.9 $ 50.4
Organic 28.8 47.0 % 11.5 23.0 % 3.7
International Go-to-Market 1.8 2.9 % — — % —
Impact of currency (33.7)(54.9)% — — % (4.2)
Segment Profit - current year $ 58.3 (5.0)% $ 61.4 23.0 % $ 49.9
Asia Pacific
Segment Profit - prior year $ 97.1 $ 98.2 $ 85.9
Organic 0.9 0.9 % 7.7 7.9 % 13.9
International Go-to-Market (0.9)(0.9)% — — % —
Impact of currency (19.2)(19.8)% (8.8) (9.0)% (1.6)
Segment Profit - current year $ 77.9 (19.8)% $ 97.1 (1.1)% $ 98.2
Total Segment Profit
Segment Profit - prior year $ 448.8 $ 488.1 $ 471.5
Organic 17.3 3.9 % (15.0) (3.1)% 28.3
International Go-to-Market 2.9 0.6 % — — % —
Change in Venezuela results (10.6)(2.4)% — — % —
Impact of currency (66.9)(14.9)% (24.3) (5.0)% (11.7)
Segment Profit - current year $ 391.5 (12.8)% $ 448.8 (8.1)% $ 488.1
Refer to Note 21, Segments, in the Consolidated Financial Statements for a reconciliation from segment profit
to earnings before income taxes.
Total segment profit in fiscal 2015 was $391.5, a decrease of 12.8% versus the prior fiscal year, including a
decrease of $66.9, or 14.9%, due to unfavorable movement in foreign currency rates, a $10.6 decrease due to the
change in Venezuela results (due to the previously announced deconsolidation) and a $2.9 increase related to the initial
impacts of the international go-to-market changes (including exits and shift to distributors). Excluding the impact of
these items, organic segment profit increased 3.9%. Segment operating profit results for the twelve months ended
September 30, 2015 are as follows:
• North America segment profit was $234.6, a decrease of $29.3, or 11.1%, versus the prior fiscal year inclusive
of the negative $4.8 impact of currency movements. Excluding the impact of currency movements, segment
profit decreased $24.5, or 9.3%, due to the gross profit impact of the net sales shortfall mentioned above as well
as increased A&P spending driven by the launch of EcoAdvanced. These items were partially offset by
savings realized from the 2013 restructuring project.