Energizer 2015 Annual Report Download - page 33
Download and view the complete annual report
Please find page 33 of the 2015 Energizer annual report below. You can navigate through the pages in the report by either clicking on the pages listed below, or by using the keyword search tool below to find specific information within the annual report.-
 1
1 -
2
-
3
-
4
-
5
-
6
-
7
-
8
-
9
-
10
-
11
-
12
-
13
-
14
-
15
-
16
-
17
-
18
-
19
-
20
-
21
-
22
-
 23
23 -
 24
24 -
 25
25 -
 26
26 -
 27
27 -
 28
28 -
 29
29 -
 30
30 -
 31
31 -
 32
32 -
 33
33 -
 34
34 -
 35
35 -
 36
36 -
 37
37 -
 38
38 -
 39
39 -
 40
40 -
 41
41 -
 42
42 -
 43
43 -
44
-
45
-
46
-
47
-
48
-
49
-
50
-
51
-
52
-
53
-
54
-
55
-
56
-
57
-
58
-
59
-
60
-
61
-
62
-
63
-
64
-
65
-
66
-
67
-
68
-
69
-
70
-
71
-
72
-
73
-
74
-
75
-
76
-
77
-
78
-
79
-
80
-
81
-
82
-
83
-
84
-
85
-
86
-
87
-
88
-
89
-
90
-
91
-
92
-
93
-
94
-
95
-
96
-
97
-
98
-
99
 |
 |

29
Operating Results
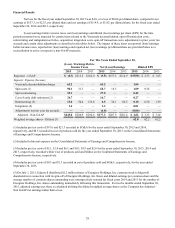
Net Sales
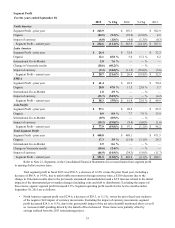
Net Sales - Total Company
For the Years Ended September 30,
2015 % Chg 2014 % Chg 2013
Net sales - prior year $ 1,840.4 $ 2,012.2 $ 2,087.7
Organic (65.4)(3.6)% (136.9) (6.8)% (59.5)
International Go-to-Market (1) (16.4)(0.9)% — —% —
Change in Venezuela results (2) (17.3)(0.9)% — —% —
Impact of currency (109.7)(5.9)% (34.9) (1.7)% (16.0)
Net sales - current year $ 1,631.6 (11.3)% $ 1,840.4 (8.5)% $ 2,012.2
(1) To compete more effectively as an independent company, we intend to increase our use of exclusive and non-exclusive
third-party distributors and wholesalers, and decrease or eliminate our business operations in certain countries, consistent
with our international go-to-market strategy. In order to capture the impact of these international go-to-market changes and
exits, we have separately identified the impact within the tables below, which represents the year over year change in those
markets since the date of exit. We expect to realize the majority of this impact from these changes in the upcoming three
quarters. The market exits should be fully realized in the earlier part of that time frame, while the distributor transition may
be more protracted.
(2) As previously announced, we deconsolidated our Venezuelan subsidiaries on March 31, 2015 and began accounting for our
investment in our Venezuelan operations using the cost method of accounting. Subsequent to March 31, 2015, our financial
results will not include the operating results of our Venezuelan operations. As a result of the deconsolidation, we have taken the
year over year change in Venezuela results and separately identified that impact in the tables below.
Net sales for the year ended September 30, 2015 decreased 11.3%, inclusive of a $109.7, or 5.9%, due to the
unfavorable impact of currency movements, $17.3, or 0.9%, due to change in Venezuela results as a result of the
deconsolidation and $16.4, or 0.9%, related to the initial impacts of the international go-to-market changes (including exits and
shift to distributors). Excluding the impact of these unfavorable items, organic sales decreased $65.4, or 3.6%, primarily due to:
• The timing of holiday shipments and temporary prior year shelf gains that were not repeated in the current fiscal year
which account for approximately 4.7% of the total organic net sales decline;
• Partially offset by space and distribution gains, primarily in Western Europe, which accounted for 1.1%.
Net sales for the year ended September 30, 2014 decreased 8.5%, inclusive of a 1.7% decline due to unfavorable
currency movements. Excluding the impact of currency movements, organic sales declined 6.8% due primarily to reduced
volumes as a result of:
• loss of distribution, resulting in lower sales, within two U.S. retail customers (which occurred in the fourth quarter of
fiscal 2013) which accounted for approximately 5% of the total organic net sales decline;
• continued household battery category volume declines due in part to more devices using built-in rechargeable battery
systems; and
• hurricane response storm volumes that occurred in fiscal 2013 but did not repeat in fiscal 2014, which accounted for
approximately 1% of the total organic net sales decline.
For further discussion regarding net sales in each of our geographic segments, including a summary of reported versus
organic changes, please see the section titled “Segment Results” provided below.