Energizer 2015 Annual Report Download - page 77
Download and view the complete annual report
Please find page 77 of the 2015 Energizer annual report below. You can navigate through the pages in the report by either clicking on the pages listed below, or by using the keyword search tool below to find specific information within the annual report.-
 1
1 -
2
-
3
-
4
-
5
-
6
-
7
-
8
-
9
-
10
-
11
-
12
-
13
-
14
-
15
-
16
-
17
-
18
-
19
-
20
-
21
-
22
-
23
-
24
-
25
-
26
-
27
-
28
-
29
-
30
-
31
-
32
-
33
-
34
-
35
-
36
-
37
-
38
-
39
-
40
-
41
-
42
-
43
-
44
-
45
-
46
-
47
-
48
-
49
-
50
-
51
-
52
-
53
-
54
-
55
-
56
-
57
-
58
-
59
-
60
-
61
-
62
-
63
-
64
-
65
-
66
-
 67
67 -
 68
68 -
 69
69 -
 70
70 -
 71
71 -
 72
72 -
 73
73 -
 74
74 -
 75
75 -
 76
76 -
 77
77 -
 78
78 -
 79
79 -
 80
80 -
 81
81 -
 82
82 -
 83
83 -
 84
84 -
 85
85 -
 86
86 -
 87
87 -
88
-
89
-
90
-
91
-
92
-
93
-
94
-
95
-
96
-
97
-
98
-
99
 |
 |
ENERGIZER HOLDINGS, INC.
NOTES TO CONSOLIDATED FINANCIAL STATEMENTS
(Dollars in millions, except per share)
73
At September 30, 2014 For the Year Ended
September 30, 2014
Derivatives not designated as Cash Flow Hedging Relationships Estimated Fair Value Asset
(Liability) Gain/(Loss) Recognized in
Income (1)
Share option (2) $ — $ 7.1
Foreign currency contracts 1.0 1.2
Total $ 1.0 $ 8.3
1. Gain/(loss) recognized in Income was recorded as follows: Share option in Selling, general and administrative expense and foreign currency and commodity
contracts in Other financing, items, net.
2. Edgewell held a share option with a major financial institution, which matured in November 2014 and was subsequently not renewed.
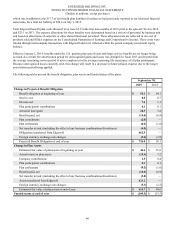
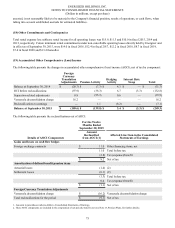
Energizer has the following recognized financial assets and financial liabilities resulting from those transactions that meet the
scope of the disclosure requirements as necessitated by applicable accounting guidance for balance sheet offsetting:
Offsetting of derivative assets
At September 30, 2015 At September 30, 2014
Description Balance Sheet
location
Gross amounts
of recognized
assets
Gross amounts
offset in the
Balance Sheet
Net amounts of
assets
presented in
the Balance
Sheet
Gross amounts
of recognized
assets
Gross amounts
offset in the
Balance Sheet
Net amounts of
assets
presented in
the Balance
Sheet
Foreign Currency
Contracts
Other Current
Assets, Other
Assets $ 4.9 $ (0.4) $ 4.5 $ 7.2 $ (0.2) $ 7.0
Offsetting of derivative liabilities
At September 30, 2015 At September 30, 2014
Description Balance Sheet
location
Gross amounts
of recognized
liabilities
Gross amounts
offset in the
Balance Sheet
Net amounts of
liabilities
presented in
the Balance
Sheet
Gross amounts
of recognized
liabilities
Gross amounts
offset in the
Balance Sheet
Net amounts of
liabilities
presented in
the Balance
Sheet
Foreign Currency
Contracts
Other Current
Liabilities, Other
Liabilities $ — $ — $ — $ (0.8) $ 0.2 $ (0.6)
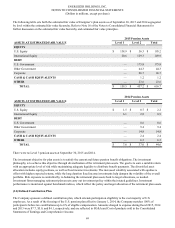
Fair Value Hierarchy – Accounting guidance on fair value measurements for certain financial assets and liabilities requires that
assets and liabilities carried at fair value be classified in one of the following three categories:
Level 1: Quoted market prices in active markets for identical assets or liabilities.
Level 2: Observable market-based inputs or unobservable inputs that are corroborated by market data.
Level 3: Unobservable inputs reflecting the reporting entity’s own assumptions or external inputs from inactive markets.
Under the fair value accounting guidance hierarchy, an entity is required to maximize the use of quoted market prices and
minimize the use of unobservable inputs. The following table sets forth the Company's financial assets and liabilities, which are
carried at fair value, as of September 30, 2015 and 2014 that are measured on a recurring basis during the period, segregated by
level within the fair value hierarchy: