Energizer 2015 Annual Report Download - page 34
Download and view the complete annual report
Please find page 34 of the 2015 Energizer annual report below. You can navigate through the pages in the report by either clicking on the pages listed below, or by using the keyword search tool below to find specific information within the annual report.-
 1
1 -
2
-
3
-
4
-
5
-
6
-
7
-
8
-
9
-
10
-
11
-
12
-
13
-
14
-
15
-
16
-
17
-
18
-
19
-
20
-
21
-
22
-
23
-
 24
24 -
 25
25 -
 26
26 -
 27
27 -
 28
28 -
 29
29 -
 30
30 -
 31
31 -
 32
32 -
 33
33 -
 34
34 -
 35
35 -
 36
36 -
 37
37 -
 38
38 -
 39
39 -
 40
40 -
 41
41 -
 42
42 -
 43
43 -
 44
44 -
45
-
46
-
47
-
48
-
49
-
50
-
51
-
52
-
53
-
54
-
55
-
56
-
57
-
58
-
59
-
60
-
61
-
62
-
63
-
64
-
65
-
66
-
67
-
68
-
69
-
70
-
71
-
72
-
73
-
74
-
75
-
76
-
77
-
78
-
79
-
80
-
81
-
82
-
83
-
84
-
85
-
86
-
87
-
88
-
89
-
90
-
91
-
92
-
93
-
94
-
95
-
96
-
97
-
98
-
99
 |
 |
30
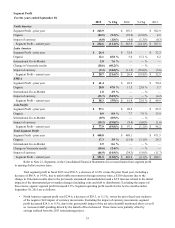
Gross Profit
Gross profit dollars were $756.2 in fiscal 2015 versus $850.4 in fiscal 2014. The decrease in gross profit dollars
was due primarily to the decline in net sales mentioned earlier and unfavorable foreign currency movements of
approximately $99.
Gross margin as a percent of net sales for fiscal 2015 was 46.3% which was flat against the prior year. Excluding
the impacts of currencies of approximately $99, change in Venezuela results of $13.5 and international go-to-market
changes of approximately $4, the gross margin rate increased 330 basis points from continued cost reductions and modest
commodity cost favorability.
Gross profit dollars were $850.4 in fiscal 2014 versus $901.9 in fiscal 2013. The decrease in gross profit in fiscal 2014
as compared to fiscal 2013 was due primarily to the decline in net sales mentioned earlier and unfavorable foreign currency
movements of $33.7.
Gross margin as a percent of net sales for fiscal 2014 was 46.2%, up approximately 140 basis points as compared to
fiscal 2013. The increase was driven by the favorable impact of the 2013 restructuring project offset by the unfavorable
currency impact.
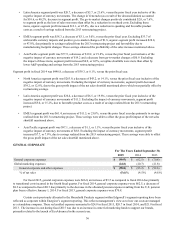
Selling, General and Administrative
Selling, General and Administrative (SG&A) expenses were $426.3 in fiscal 2015, or 26.1% of net sales as compared
to $391.3, or 21.3% of net sales for fiscal 2014 and $387.7, or 19.3% of net sales for fiscal 2013. Included in SG&A in fiscal
2015 was approximately $107 of special charges. Separation charges of $97.6 were included in this amount and primarily
related to the execution of the spin-off transaction. Also included were approximately $9 related to integration, restructuring
initiatives and transitional expenses related to the separation. Similarly, fiscal years 2014 and 2013 included $5.9 and $2.6,
respectively, of charges directly associated with our restructuring initiatives that were recorded within SG&A. In addition,
fiscal 2014 also included $21.3 of pre-tax separation related charges. Excluding the impacts of these items, SG&A as a percent
of net sales was 20.0% in fiscal 2015 as compared to 19.8% in fiscal 2014 and 19.1% in fiscal 2013.
Advertising and Sales Promotion
For fiscal 2015, advertising and sales promotion expense (A&P) was $132.3, up $10.6 as compared to fiscal 2014.
A&P as a percent of net sales was 8.1% for fiscal 2015 and was 6.6% and 6.3% in fiscal years 2014 and 2013, respectively. The
higher level of A&P spending as a percentage of net sales in fiscal years 2015 versus 2014 was due to increased support behind
our brands and the launch of EcoAdvanced, which occurred in the second fiscal quarter of 2015. The higher level of A&P
spending as a percentage of net sales in fiscal years 2014 versus 2013 was due to the increase in overall strategic brand support
initiative spending. A&P expense may vary from year to year due to new product launches, strategic brand support initiatives,
the overall competitive environment, as well as the type of A&P spending.
Research and Development
Research and development (R&D) expense was $24.9 in fiscal 2015, $25.3 in fiscal 2014 and $29.7 in fiscal 2013.
The decreases in fiscal years 2015 and 2014 were due primarily to cost reductions as a result of our 2013 restructuring project.
As a percent of net sales, R&D expense was 1.5% in fiscal 2015, 1.4% in fiscal 2014 and 1.5% in fiscal 2013.
Interest and Other Financing Items, Net
Interest expense for fiscal 2015 was $77.9, an increase of $25.2 as compared to fiscal 2014. Included within fiscal
2015 interest expense were debt breakage fees of $26.7, which were allocated to Energizer in the third fiscal quarter as a result
of the April notice of prepayment to the holders of Edgewell's outstanding notes. Excluding the debt breakage fees, interest was
$51.2, down $1.5 in comparison to the prior year. This was due primarily to lower interest costs resulting from lower average
interest rates on debt outstanding. Interest expense for fiscal 2014 was $52.7, a decrease of $15.4 as compared to fiscal 2013
due to lower allocated interest costs from Edgewell based on their lower average debt outstanding. Interest expense for fiscal
2013 was $68.1. Interest expense for the first three quarters of fiscal 2015 and all of fiscal 2014 and 2013 was based on an
allocation from Edgewell.