Dollar General 2012 Annual Report Download - page 51
Download and view the complete annual report
Please find page 51 of the 2012 Dollar General annual report below. You can navigate through the pages in the report by either clicking on the pages listed below, or by using the keyword search tool below to find specific information within the annual report.-
 1
1 -
2
-
3
-
4
-
5
-
6
-
7
-
8
-
9
-
10
-
11
-
12
-
13
-
14
-
15
-
16
-
17
-
18
-
19
-
20
-
21
-
22
-
23
-
24
-
25
-
26
-
27
-
28
-
29
-
30
-
31
-
32
-
33
-
34
-
35
-
36
-
37
-
38
-
39
-
40
-
 41
41 -
 42
42 -
 43
43 -
 44
44 -
 45
45 -
 46
46 -
 47
47 -
 48
48 -
 49
49 -
 50
50 -
 51
51 -
 52
52 -
 53
53 -
 54
54 -
 55
55 -
 56
56 -
 57
57 -
 58
58 -
 59
59 -
 60
60 -
 61
61 -
62
-
63
-
64
-
65
-
66
-
67
-
68
-
69
-
70
-
71
-
72
-
73
-
74
-
75
-
76
-
77
-
78
-
79
-
80
-
81
-
82
-
83
-
84
-
85
-
86
-
87
-
88
-
89
-
90
-
91
-
92
-
93
-
94
-
95
-
96
-
97
-
98
-
99
-
100
-
101
-
102
-
103
-
104
-
105
-
106
-
107
-
108
-
109
-
110
-
111
-
112
-
113
-
114
-
115
-
116
-
117
-
118
-
119
-
120
-
121
-
122
-
123
-
124
-
125
-
126
-
127
-
128
-
129
-
130
-
131
-
132
-
133
-
134
-
135
-
136
-
137
-
138
-
139
-
140
-
141
-
142
-
143
-
144
-
145
-
146
-
147
-
148
-
149
-
150
-
151
-
152
-
153
-
154
-
155
-
156
-
157
-
158
-
159
-
160
-
161
-
162
-
163
-
164
-
165
-
166
-
167
-
168
-
169
-
170
-
171
-
172
-
173
-
174
-
175
-
176
-
177
-
178
-
179
-
180
-
181
-
182
-
183
-
184
-
185
-
186
-
187
-
188
-
189
-
190
-
191
-
192
-
193
-
194
-
195
-
196
-
197
 |
 |

Proxy
March 20, 2014 and 50% on March 20, 2015, subject to certain accelerated vesting provisions as described in ‘‘Potential Payments
upon Termination or Change in Control’’ below. The market value was computed by multiplying the number of such units by the
closing market price of one share of our common stock on February 1, 2013.
(7) These options are part of a grant of performance-based options that vested or are scheduled to vest (a) as to 8,333 shares on
January 30, 2009, 50,000 shares on each of January 29, 2010, January 28, 2011, February 3, 2012 and February 1, 2013, and 41,667
shares on January 31, 2014, if we achieve annual adjusted EBITDA-based targets for the applicable fiscal year; or (b) on a ‘‘catch
up’’ basis if an applicable cumulative adjusted EBITDA-based target is achieved at the end of fiscal year 2013 or 2014. These
options are subject to certain accelerated vesting provisions as described in ‘‘Potential Payments upon Termination or Change in
Control’’ below. We achieved the annual financial targets for each of the 2008- 2012 fiscal years, and a portion of the options
reported as exercisable vested on an accelerated basis on December 14, 2010 (417 shares), June 11, 2012 (2,917 shares), October 3,
2012 (28,250 shares), October 10, 2012 (4,250 shares), October 11, 2012 (3,750 shares), November 27, 2012 (1,250 shares),
November 28, 2012 (1,000 shares), November 29, 2012 (2,250 shares) and November 30, 2012 (5,250 shares).
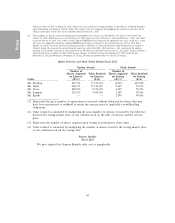
Option Exercises and Stock Vested During Fiscal 2012
Option Awards Stock Awards
Number of Number of
Shares Acquired Value Realized Shares Acquired Value Realized
on Exercise on Exercise on Vesting on Vesting
Name (#)(1) ($)(2) (#)(3) ($)(4)
Mr. Dreiling 425,512 17,572,324 13,094 605,990
Mr. Tehle 386,171 15,511,027 2,149 99,456
Mr. Vasos 228,760 9,154,305 2,149 99,456
Ms. Lanigan 235,256 9,459,266 2,149 99,456
Mr. Sparks — — 2,149 99,456
(1) Represents the gross number of option shares exercised, without deduction for shares that may
have been surrendered or withheld to satisfy the exercise price or applicable tax withholding
obligations.
(2) Value realized is calculated by multiplying the gross number of options exercised by the difference
between the closing market price of our common stock on the date of exercise and the exercise
price.
(3) Represents the number of shares acquired upon vesting of performance share units.
(4) Value realized is calculated by multiplying the number of shares vested by the closing market price
of our common stock on the vesting date.
Pension Benefits
Fiscal 2012
We have omitted the Pension Benefits table as it is inapplicable.
44