Dollar General 2012 Annual Report Download - page 146
Download and view the complete annual report
Please find page 146 of the 2012 Dollar General annual report below. You can navigate through the pages in the report by either clicking on the pages listed below, or by using the keyword search tool below to find specific information within the annual report.-
 1
1 -
2
-
3
-
4
-
5
-
6
-
7
-
8
-
9
-
10
-
11
-
12
-
13
-
14
-
15
-
16
-
17
-
18
-
19
-
20
-
21
-
22
-
23
-
24
-
25
-
26
-
27
-
28
-
29
-
30
-
31
-
32
-
33
-
34
-
35
-
36
-
37
-
38
-
39
-
40
-
41
-
42
-
43
-
44
-
45
-
46
-
47
-
48
-
49
-
50
-
51
-
52
-
53
-
54
-
55
-
56
-
57
-
58
-
59
-
60
-
61
-
62
-
63
-
64
-
65
-
66
-
67
-
68
-
69
-
70
-
71
-
72
-
73
-
74
-
75
-
76
-
77
-
78
-
79
-
80
-
81
-
82
-
83
-
84
-
85
-
86
-
87
-
88
-
89
-
90
-
91
-
92
-
93
-
94
-
95
-
96
-
97
-
98
-
99
-
100
-
101
-
102
-
103
-
104
-
105
-
106
-
107
-
108
-
109
-
110
-
111
-
112
-
113
-
114
-
115
-
116
-
117
-
118
-
119
-
120
-
121
-
122
-
123
-
124
-
125
-
126
-
127
-
128
-
129
-
130
-
131
-
132
-
133
-
134
-
135
-
 136
136 -
 137
137 -
 138
138 -
 139
139 -
 140
140 -
 141
141 -
 142
142 -
 143
143 -
 144
144 -
 145
145 -
 146
146 -
 147
147 -
 148
148 -
 149
149 -
 150
150 -
 151
151 -
 152
152 -
 153
153 -
 154
154 -
 155
155 -
 156
156 -
157
-
158
-
159
-
160
-
161
-
162
-
163
-
164
-
165
-
166
-
167
-
168
-
169
-
170
-
171
-
172
-
173
-
174
-
175
-
176
-
177
-
178
-
179
-
180
-
181
-
182
-
183
-
184
-
185
-
186
-
187
-
188
-
189
-
190
-
191
-
192
-
193
-
194
-
195
-
196
-
197
 |
 |

10-K
DOLLAR GENERAL CORPORATION AND SUBSIDIARIES
NOTES TO CONSOLIDATED FINANCIAL STATEMENTS (Continued)
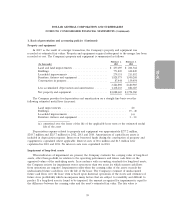
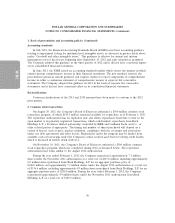
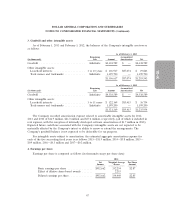
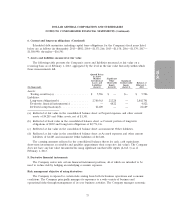
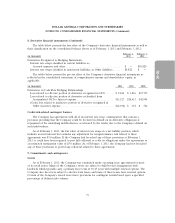
3. Goodwill and other intangible assets
As of February 1, 2013 and February 3, 2012, the balances of the Company’s intangible assets were
as follows:
As of February 1, 2013
Remaining Accumulated
(In thousands) Life Amount Amortization Net
Goodwill ............................. Indefinite $4,338,589 $ — $4,338,589
Other intangible assets:
Leasehold interests .................... 1 to 10 years $ 106,917 $87,074 $ 19,843
Trade names and trademarks ............. Indefinite 1,199,700 — 1,199,700
$1,306,617 $87,074 $1,219,543
As of February 3, 2012
Remaining Accumulated
(In thousands) Life Amount Amortization Net
Goodwill ............................. Indefinite $4,338,589 $ — $4,338,589
Other intangible assets:
Leasehold interests .................... 1 to 11 years $ 122,169 $85,415 $ 36,754
Trade names and trademarks ............. Indefinite 1,199,200 — 1,199,200
$1,321,369 $85,415 $1,235,954
The Company recorded amortization expense related to amortizable intangible assets for 2012,
2011 and 2010 of $16.9 million, $21.0 million and $27.4 million, respectively, (all of which is included in
rent expense, with the exception of internally developed software amortization of $1.7 million in 2010).
Expected future cash flows associated with the Company’s intangible assets are not expected to be
materially affected by the Company’s intent or ability to renew or extend the arrangements. The
Company’s goodwill balance is not expected to be deductible for tax purposes.
For intangible assets subject to amortization, the estimated aggregate amortization expense for
each of the five succeeding fiscal years is as follows: 2013—$11.9 million, 2014—$5.8 million, 2015—
$0.9 million, 2016—$0.3 million and 2017—$0.2 million.
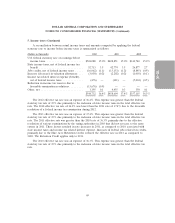
4. Earnings per share
Earnings per share is computed as follows (in thousands except per share data):
2012
Net Weighted Average Per Share
Income Shares Amount
Basic earnings per share ................ $952,662 332,254 $2.87
Effect of dilutive share-based awards ....... 2,215
Diluted earnings per share ............... $952,662 334,469 $2.85
67