Dollar General 2012 Annual Report Download - page 164
Download and view the complete annual report
Please find page 164 of the 2012 Dollar General annual report below. You can navigate through the pages in the report by either clicking on the pages listed below, or by using the keyword search tool below to find specific information within the annual report.-
 1
1 -
2
-
3
-
4
-
5
-
6
-
7
-
8
-
9
-
10
-
11
-
12
-
13
-
14
-
15
-
16
-
17
-
18
-
19
-
20
-
21
-
22
-
23
-
24
-
25
-
26
-
27
-
28
-
29
-
30
-
31
-
32
-
33
-
34
-
35
-
36
-
37
-
38
-
39
-
40
-
41
-
42
-
43
-
44
-
45
-
46
-
47
-
48
-
49
-
50
-
51
-
52
-
53
-
54
-
55
-
56
-
57
-
58
-
59
-
60
-
61
-
62
-
63
-
64
-
65
-
66
-
67
-
68
-
69
-
70
-
71
-
72
-
73
-
74
-
75
-
76
-
77
-
78
-
79
-
80
-
81
-
82
-
83
-
84
-
85
-
86
-
87
-
88
-
89
-
90
-
91
-
92
-
93
-
94
-
95
-
96
-
97
-
98
-
99
-
100
-
101
-
102
-
103
-
104
-
105
-
106
-
107
-
108
-
109
-
110
-
111
-
112
-
113
-
114
-
115
-
116
-
117
-
118
-
119
-
120
-
121
-
122
-
123
-
124
-
125
-
126
-
127
-
128
-
129
-
130
-
131
-
132
-
133
-
134
-
135
-
136
-
137
-
138
-
139
-
140
-
141
-
142
-
143
-
144
-
145
-
146
-
147
-
148
-
149
-
150
-
151
-
152
-
153
-
 154
154 -
 155
155 -
 156
156 -
 157
157 -
 158
158 -
 159
159 -
 160
160 -
 161
161 -
 162
162 -
 163
163 -
 164
164 -
 165
165 -
 166
166 -
 167
167 -
 168
168 -
 169
169 -
 170
170 -
 171
171 -
 172
172 -
 173
173 -
 174
174 -
175
-
176
-
177
-
178
-
179
-
180
-
181
-
182
-
183
-
184
-
185
-
186
-
187
-
188
-
189
-
190
-
191
-
192
-
193
-
194
-
195
-
196
-
197
 |
 |

10-K
DOLLAR GENERAL CORPORATION AND SUBSIDIARIES
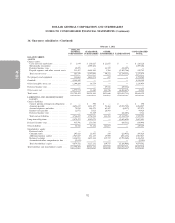
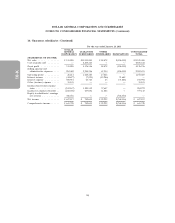
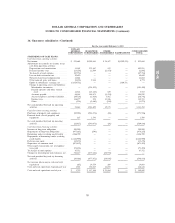
NOTES TO CONSOLIDATED FINANCIAL STATEMENTS (Continued)
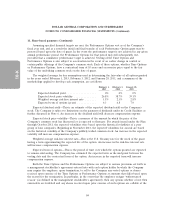
11. Share-based payments (Continued)
Company’s option at an amount equal to the lesser of fair value or the amount paid for the shares
(i.e., the exercise price). In such cases, because the employee would not benefit in any share
appreciation over the exercise price, for accounting purposes such options are not considered vested
until the expiration of the Company’s call option, which is generally five years subsequent to the date
of grant. Accordingly, all references to the vesting provisions or vested status of the options discussed
in this note give effect to the vesting pursuant to these accounting provisions and may differ from
descriptions of the vesting status of the Time Options and Performance Options located elsewhere in
this report or the Company’s other SEC filings.
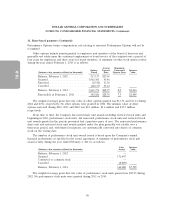
A summary of Time Options activity during the year ended February 1, 2013 is as follows:
Remaining
Average Contractual
Options Exercise Term Intrinsic
(Intrinsic value amounts reflected in thousands) Issued Price in Years Value
Balance, February 3, 2012 ........... 4,258,581 $10.55
Granted ........................ — —
Exercised ....................... (2,861,681) 8.97
Canceled ....................... (46,258) 16.10
Balance, February 1, 2013 ........... 1,350,642 $13.69 5.9 $44,017
Exercisable at February 1, 2013 ....... 723,335 $11.42 5.4 $25,215
The weighted average grant date fair value of Time Options granted during 2011 and 2010 was
$13.47 and $12.61, respectively. The intrinsic value of Time Options exercised during 2012, 2011 and
2010 was $117.3 million, $41.4 million and $5.5 million, respectively.
A summary of Performance Options activity during the year ended February 1, 2013 is as follows:
Average Remaining
Options Exercise Contractual Intrinsic
(Intrinsic value amounts reflected in thousands) Issued Price Term in Years Value
Balance, February 3, 2012 .......... 3,968,237 $10.75
Granted ....................... — —
Exercised ...................... (2,661,902) 9.12
Canceled ...................... (41,509) 16.87
Balance, February 1, 2013 .......... 1,264,826 $13.96 6.0 $40,879
Exercisable at February 1, 2013 ...... 916,223 $12.61 5.8 $30,850
The weighted average grant date fair value of Performance Options granted during 2011 and 2010
was $13.47 and $12.61, respectively. The intrinsic value of Performance Options exercised during 2012,
2011 and 2010 was $106.4 million, $41.8 million and $14.7 million, respectively.
The Company currently believes that the performance targets related to the unvested Performance
Options will be achieved. If such goals are not met, and there is no change in control or certain public
offerings of the Company’s common stock which would result in the acceleration of vesting of the
85