Dollar General 2012 Annual Report Download - page 139
Download and view the complete annual report
Please find page 139 of the 2012 Dollar General annual report below. You can navigate through the pages in the report by either clicking on the pages listed below, or by using the keyword search tool below to find specific information within the annual report.-
 1
1 -
2
-
3
-
4
-
5
-
6
-
7
-
8
-
9
-
10
-
11
-
12
-
13
-
14
-
15
-
16
-
17
-
18
-
19
-
20
-
21
-
22
-
23
-
24
-
25
-
26
-
27
-
28
-
29
-
30
-
31
-
32
-
33
-
34
-
35
-
36
-
37
-
38
-
39
-
40
-
41
-
42
-
43
-
44
-
45
-
46
-
47
-
48
-
49
-
50
-
51
-
52
-
53
-
54
-
55
-
56
-
57
-
58
-
59
-
60
-
61
-
62
-
63
-
64
-
65
-
66
-
67
-
68
-
69
-
70
-
71
-
72
-
73
-
74
-
75
-
76
-
77
-
78
-
79
-
80
-
81
-
82
-
83
-
84
-
85
-
86
-
87
-
88
-
89
-
90
-
91
-
92
-
93
-
94
-
95
-
96
-
97
-
98
-
99
-
100
-
101
-
102
-
103
-
104
-
105
-
106
-
107
-
108
-
109
-
110
-
111
-
112
-
113
-
114
-
115
-
116
-
117
-
118
-
119
-
120
-
121
-
122
-
123
-
124
-
125
-
126
-
127
-
128
-
 129
129 -
 130
130 -
 131
131 -
 132
132 -
 133
133 -
 134
134 -
 135
135 -
 136
136 -
 137
137 -
 138
138 -
 139
139 -
 140
140 -
 141
141 -
 142
142 -
 143
143 -
 144
144 -
 145
145 -
 146
146 -
 147
147 -
 148
148 -
 149
149 -
150
-
151
-
152
-
153
-
154
-
155
-
156
-
157
-
158
-
159
-
160
-
161
-
162
-
163
-
164
-
165
-
166
-
167
-
168
-
169
-
170
-
171
-
172
-
173
-
174
-
175
-
176
-
177
-
178
-
179
-
180
-
181
-
182
-
183
-
184
-
185
-
186
-
187
-
188
-
189
-
190
-
191
-
192
-
193
-
194
-
195
-
196
-
197
 |
 |

10-K
DOLLAR GENERAL CORPORATION AND SUBSIDIARIES
NOTES TO CONSOLIDATED FINANCIAL STATEMENTS (Continued)
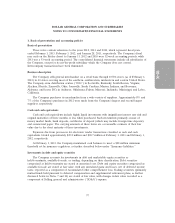
1. Basis of presentation and accounting policies (Continued)
estimated based primarily upon estimated future cash flows (discounted at the Company’s credit
adjusted risk-free rate) or other reasonable estimates of fair market value. Assets to be disposed of are
adjusted to the fair value less the cost to sell if less than the book value.
The Company recorded impairment charges included in SG&A expense of approximately
$2.7 million in 2012, $1.0 million in 2011 and $1.7 million in 2010, to reduce the carrying value of
certain of its stores’ assets. Such action was deemed necessary based on the Company’s evaluation that
such amounts would not be recoverable primarily due to insufficient sales or excessive costs resulting in
negative current and projected future cash flows at these locations.
Goodwill and other intangible assets
The Company amortizes intangible assets over their estimated useful lives unless such lives are
deemed indefinite. Goodwill and other intangible assets are tested for impairment when indicators of
impairment are present. Quantitative impairment tests for indefinite-lived intangible assets are based on
undiscounted cash flows, and if impaired, the associated assets must be written down to fair value
based on either discounted cash flows or appraised values.
In accordance with accounting standards for goodwill and indefinite-lived intangible assets, an
entity has the option first to assess qualitative factors to determine whether events and circumstances
indicate that it is more likely than not that goodwill or an indefinite-lived intangible asset is impaired.
If after such assessment an entity concludes that the asset is not impaired, then the entity is not
required to take further action. However, if an entity concludes otherwise, then it is required to
determine the fair value of the asset using a quantitative impairment test.
Goodwill and intangible assets with indefinite lives are tested for impairment annually or more
frequently if indicators of impairment are present and written down to fair value as required. No
impairment of intangible assets has been identified during any of the periods presented.
The quantitative goodwill impairment test is a two-step process that requires management to make
judgments in determining what assumptions to use in the calculation. The first step of the process
consists of estimating the fair value of the Company’s reporting unit based on valuation techniques
(including a discounted cash flow model using revenue and profit forecasts) and comparing that
estimated fair value with the recorded carrying value, which includes goodwill. If the estimated fair
value is less than the carrying value, a second step is performed to compute the amount of the
impairment by determining an ‘‘implied fair value’’ of goodwill. The determination of the implied fair
value of goodwill would require the Company to allocate the estimated fair value of its reporting unit
to its assets and liabilities. Any unallocated fair value would represent the implied fair value of
goodwill, which would be compared to its corresponding carrying value.
Other assets
Noncurrent Other assets consist primarily of qualifying prepaid expenses, debt issuance costs which
are amortized over the life of the related obligations, deferred compensation obligations, and utility and
security deposits.
60