Dollar General 2012 Annual Report Download - page 114
Download and view the complete annual report
Please find page 114 of the 2012 Dollar General annual report below. You can navigate through the pages in the report by either clicking on the pages listed below, or by using the keyword search tool below to find specific information within the annual report.-
 1
1 -
2
-
3
-
4
-
5
-
6
-
7
-
8
-
9
-
10
-
11
-
12
-
13
-
14
-
15
-
16
-
17
-
18
-
19
-
20
-
21
-
22
-
23
-
24
-
25
-
26
-
27
-
28
-
29
-
30
-
31
-
32
-
33
-
34
-
35
-
36
-
37
-
38
-
39
-
40
-
41
-
42
-
43
-
44
-
45
-
46
-
47
-
48
-
49
-
50
-
51
-
52
-
53
-
54
-
55
-
56
-
57
-
58
-
59
-
60
-
61
-
62
-
63
-
64
-
65
-
66
-
67
-
68
-
69
-
70
-
71
-
72
-
73
-
74
-
75
-
76
-
77
-
78
-
79
-
80
-
81
-
82
-
83
-
84
-
85
-
86
-
87
-
88
-
89
-
90
-
91
-
92
-
93
-
94
-
95
-
96
-
97
-
98
-
99
-
100
-
101
-
102
-
103
-
 104
104 -
 105
105 -
 106
106 -
 107
107 -
 108
108 -
 109
109 -
 110
110 -
 111
111 -
 112
112 -
 113
113 -
 114
114 -
 115
115 -
 116
116 -
 117
117 -
 118
118 -
 119
119 -
 120
120 -
 121
121 -
 122
122 -
 123
123 -
 124
124 -
125
-
126
-
127
-
128
-
129
-
130
-
131
-
132
-
133
-
134
-
135
-
136
-
137
-
138
-
139
-
140
-
141
-
142
-
143
-
144
-
145
-
146
-
147
-
148
-
149
-
150
-
151
-
152
-
153
-
154
-
155
-
156
-
157
-
158
-
159
-
160
-
161
-
162
-
163
-
164
-
165
-
166
-
167
-
168
-
169
-
170
-
171
-
172
-
173
-
174
-
175
-
176
-
177
-
178
-
179
-
180
-
181
-
182
-
183
-
184
-
185
-
186
-
187
-
188
-
189
-
190
-
191
-
192
-
193
-
194
-
195
-
196
-
197
 |
 |

10-K
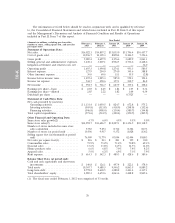
The 2010 effective tax rate of 36.3% was greater than the statutory tax rate of 35%, also due
primarily to the inclusion of state income taxes in the total effective tax rate.
Off Balance Sheet Arrangements
The entities involved in ownership structure underlying the leases for three of our distribution
centers meet the accounting definition of a Variable Interest Entity (‘‘VIE’’). One of these distribution
centers has been recorded as a financing obligation whereby its property and equipment are reflected
in our consolidated balance sheets. The land and buildings of the other two distribution centers have
been recorded as operating leases. We are not the primary beneficiary of these VIEs and, accordingly,
have not included these entities in our consolidated financial statements. Other than the foregoing, we
are not party to any off balance sheet arrangements.
Effects of Inflation
We experienced little or no overall product cost inflation in 2012 or 2010. In 2011, we experienced
increased commodity cost pressures mainly related to food, housewares and apparel products which
were driven by increases in cotton, sugar, coffee, groundnut, resin, petroleum and other raw material
commodity costs. We believe that our ability to selectively increase selling prices in response to cost
increases in 2011 partially mitigated the effect of these cost increases on our overall results of
operations.
Liquidity and Capital Resources
Current Financial Condition and Recent Developments
During the past three years, we have generated an aggregate of approximately $3.0 billion in cash
flows from operating activities and incurred approximately $1.51 billion in capital expenditures. During
that period, we expanded the number of stores we operate by 1,678, representing growth of
approximately 19%, and we remodeled or relocated 1,671 stores, or approximately 16%, of the stores
we operated as of February 1, 2013. We intend to continue our current strategy of pursuing store
growth, remodels and relocations in 2013 and for the next several years.
At February 1, 2013, we had total outstanding debt (including the current portion of long-term
obligations) of $2.77 billion, which includes our senior secured asset-based revolving credit facility
(‘‘ABL Facility’’ and, together with the Term Loan Facility, the ‘‘Credit Facilities’’), and senior notes, all
of which are described in greater detail below. We had $873.4 million available for borrowing under the
ABL Facility at February 1, 2013.
We believe our cash flow from operations and existing cash balances, combined with availability
under the Credit Facilities (described in greater detail below), and access to the debt markets will
provide sufficient liquidity to fund our current obligations, projected working capital requirements and
capital spending for a period that includes the next twelve months as well as the next several years.
We intend to refinance outstanding amounts under our secured Credit Facilities with new
unsecured long-term debt of up to $2.3 billion, expected to consist of new unsecured term loans and
new unsecured senior notes. In addition, we intend to enter into a new unsecured cash flow based
revolving credit facility, which is currently expected to have no initial revolver borrowings outstanding.
The actual amounts and type of financing is dependent on market conditions and other factors.
Although we currently anticipate completing this financing in the first quarter of 2013, there can be no
assurance that we will complete the refinancing on the foregoing terms or at all.
35