Dollar General 2012 Annual Report Download - page 174
Download and view the complete annual report
Please find page 174 of the 2012 Dollar General annual report below. You can navigate through the pages in the report by either clicking on the pages listed below, or by using the keyword search tool below to find specific information within the annual report.-
 1
1 -
2
-
3
-
4
-
5
-
6
-
7
-
8
-
9
-
10
-
11
-
12
-
13
-
14
-
15
-
16
-
17
-
18
-
19
-
20
-
21
-
22
-
23
-
24
-
25
-
26
-
27
-
28
-
29
-
30
-
31
-
32
-
33
-
34
-
35
-
36
-
37
-
38
-
39
-
40
-
41
-
42
-
43
-
44
-
45
-
46
-
47
-
48
-
49
-
50
-
51
-
52
-
53
-
54
-
55
-
56
-
57
-
58
-
59
-
60
-
61
-
62
-
63
-
64
-
65
-
66
-
67
-
68
-
69
-
70
-
71
-
72
-
73
-
74
-
75
-
76
-
77
-
78
-
79
-
80
-
81
-
82
-
83
-
84
-
85
-
86
-
87
-
88
-
89
-
90
-
91
-
92
-
93
-
94
-
95
-
96
-
97
-
98
-
99
-
100
-
101
-
102
-
103
-
104
-
105
-
106
-
107
-
108
-
109
-
110
-
111
-
112
-
113
-
114
-
115
-
116
-
117
-
118
-
119
-
120
-
121
-
122
-
123
-
124
-
125
-
126
-
127
-
128
-
129
-
130
-
131
-
132
-
133
-
134
-
135
-
136
-
137
-
138
-
139
-
140
-
141
-
142
-
143
-
144
-
145
-
146
-
147
-
148
-
149
-
150
-
151
-
152
-
153
-
154
-
155
-
156
-
157
-
158
-
159
-
160
-
161
-
162
-
163
-
 164
164 -
 165
165 -
 166
166 -
 167
167 -
 168
168 -
 169
169 -
 170
170 -
 171
171 -
 172
172 -
 173
173 -
 174
174 -
 175
175 -
 176
176 -
 177
177 -
 178
178 -
 179
179 -
 180
180 -
 181
181 -
 182
182 -
 183
183 -
 184
184 -
185
-
186
-
187
-
188
-
189
-
190
-
191
-
192
-
193
-
194
-
195
-
196
-
197
 |
 |

10-K
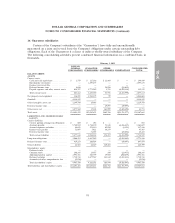
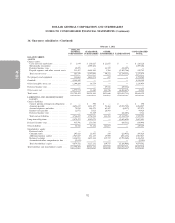
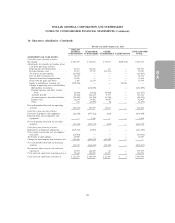
DOLLAR GENERAL CORPORATION AND SUBSIDIARIES
NOTES TO CONSOLIDATED FINANCIAL STATEMENTS (Continued)
16. Guarantor subsidiaries (Continued)
For the year ended February 1, 2013
DOLLAR
GENERAL GUARANTOR OTHER CONSOLIDATED
CORPORATION SUBSIDIARIES SUBSIDIARIES ELIMINATIONS TOTAL
STATEMENTS OF CASH FLOWS:
Cash flows from operating activities:
Net income .................... $ 952,662 $1,005,444 $ 24,107 $(1,029,551) $ 952,662
Adjustments to reconcile net income to net
cash from operating activities:
Depreciation and amortization ....... 31,385 271,367 159 — 302,911
Deferred income taxes ............ (13,256) 12,504 (1,853) — (2,605)
Tax benefit of stock options ......... (87,752) — — — (87,752)
Loss on debt retirement, net ......... 30,620 — — — 30,620
Noncash share-based compensation .... 21,664 — — — 21,664
Other noncash gains and losses ....... (2,354) 9,128 — — 6,774
Equity in subsidiaries’ earnings, net .... (1,029,551) — — 1,029,551 —
Change in operating assets and liabilities:
Merchandise inventories .......... — (391,409) — — (391,409)
Prepaid expenses and other current
assets .................... 22,814 (18,110) 849 — 5,553
Accounts payable .............. 46,388 148,871 (1,224) — 194,035
Accrued expenses and other liabilities . . (39,728) (2,424) 5,411 — (36,741)
Income taxes ................. 126,477 398 11,836 — 138,711
Other ..................... (501) (2,460) (110) — (3,071)
Net cash provided by (used in) operating
activities ..................... 58,868 1,033,309 39,175 — 1,131,352
Cash flows from investing activities:
Purchases of property and equipment ..... (29,094) (542,471) (31) — (571,596)
Proceeds from sales of property and
equipment .................... 167 1,593 — — 1,760
Net cash provided by (used in) investing
activities ..................... (28,927) (540,878) (31) — (569,836)
Cash flows from financing activities:
Issuance of long-term obligations ....... 500,000 — — — 500,000
Repayments of long-term obligations ..... (477,665) (590) — — (478,255)
Borrowings under revolving credit facility . . 2,286,700 — — — 2,286,700
Repayments of borrowings under revolving
credit facility .................. (2,184,900) — — — (2,184,900)
Debt issuance costs ................ (15,278) — — — (15,278)
Repurchase of common stock ......... (671,459) — — — (671,459)
Other equity transactions, net of employee
taxes paid .................... (71,393) — — — (71,393)
Tax benefit of stock options ........... 87,752 — — — 87,752
Changes in intercompany note balances, net . 516,217 (477,282) (38,935) — —
Net cash provided by (used in) financing
activities ..................... (30,026) (477,872) (38,935) — (546,833)
Net increase (decrease) in cash and cash
equivalents ................... (85) 14,559 209 — 14,683
Cash and cash equivalents, beginning of year 1,844 102,627 21,655 — 126,126
Cash and cash equivalents, end of year .... $ 1,759 $ 117,186 $ 21,864 $ — $ 140,809
95