Dollar General 2012 Annual Report Download - page 108
Download and view the complete annual report
Please find page 108 of the 2012 Dollar General annual report below. You can navigate through the pages in the report by either clicking on the pages listed below, or by using the keyword search tool below to find specific information within the annual report.-
 1
1 -
2
-
3
-
4
-
5
-
6
-
7
-
8
-
9
-
10
-
11
-
12
-
13
-
14
-
15
-
16
-
17
-
18
-
19
-
20
-
21
-
22
-
23
-
24
-
25
-
26
-
27
-
28
-
29
-
30
-
31
-
32
-
33
-
34
-
35
-
36
-
37
-
38
-
39
-
40
-
41
-
42
-
43
-
44
-
45
-
46
-
47
-
48
-
49
-
50
-
51
-
52
-
53
-
54
-
55
-
56
-
57
-
58
-
59
-
60
-
61
-
62
-
63
-
64
-
65
-
66
-
67
-
68
-
69
-
70
-
71
-
72
-
73
-
74
-
75
-
76
-
77
-
78
-
79
-
80
-
81
-
82
-
83
-
84
-
85
-
86
-
87
-
88
-
89
-
90
-
91
-
92
-
93
-
94
-
95
-
96
-
97
-
 98
98 -
 99
99 -
 100
100 -
 101
101 -
 102
102 -
 103
103 -
 104
104 -
 105
105 -
 106
106 -
 107
107 -
 108
108 -
 109
109 -
 110
110 -
 111
111 -
 112
112 -
 113
113 -
 114
114 -
 115
115 -
 116
116 -
 117
117 -
 118
118 -
119
-
120
-
121
-
122
-
123
-
124
-
125
-
126
-
127
-
128
-
129
-
130
-
131
-
132
-
133
-
134
-
135
-
136
-
137
-
138
-
139
-
140
-
141
-
142
-
143
-
144
-
145
-
146
-
147
-
148
-
149
-
150
-
151
-
152
-
153
-
154
-
155
-
156
-
157
-
158
-
159
-
160
-
161
-
162
-
163
-
164
-
165
-
166
-
167
-
168
-
169
-
170
-
171
-
172
-
173
-
174
-
175
-
176
-
177
-
178
-
179
-
180
-
181
-
182
-
183
-
184
-
185
-
186
-
187
-
188
-
189
-
190
-
191
-
192
-
193
-
194
-
195
-
196
-
197
 |
 |

10-K
transportation efficiencies and improvements to our pricing and markdown model, while remaining
committed to our everyday low price strategy. We constantly review our pricing strategy and work
diligently to minimize product cost increases as we focus on providing our customers with quality
merchandise at great values. In our consumables category, we strive to offer the optimal balance of the
most popular nationally advertised brands and our own private brands, which generally have higher
gross profit rates than national brands. Commodities cost inflation moderated in 2012 following a year
of significant increases throughout 2011. Accordingly, overall price increases passed through to our
customers were less in 2012. We remain committed to our seasonal, home, and apparel categories,
although we expect the growth of consumables to continue to outpace these categories again in 2013
due to anticipated continued economic pressures which limit our customers’ discretionary spending.
Our third priority is leveraging process improvements and information technology to reduce costs.
We are committed as an organization to extract costs, particularly Selling, general and administrative
expenses (SG&A) that do not affect the customer experience, and plan to utilize our procurement
capabilities and other initiatives to further these efforts. In 2012, we again focused on lowering our
store labor costs as a percentage of sales while improving our overall customer experience. We further
utilized our new workforce management system and simplified many of our store processes, resulting in
significant cost savings as a percentage of sales.
Our fourth priority is to strengthen and expand Dollar General’s culture of serving others. For
customers this means helping them ‘‘Save time. Save money. Every day!’’ by providing clean,
well-stocked stores with quality products at low prices. For employees, this means creating an
environment that attracts and retains key employees throughout the organization. For the public, this
means giving back to our store communities through our charitable and other efforts. In 2012, we,
along with our vendors, customers and employees, donated millions of dollars through our various
charitable initiatives. For shareholders, this means meeting their expectations of an efficiently and
profitably run organization that operates with compassion and integrity.
Our continued focus on these four priorities resulted in improved 2012 financial performance over
the prior year as follows. Note that fiscal 2012 consisted of 52 weeks while 2011 consisted of 53 weeks.
Basis points, as referred to below, are equal to 0.01 percent of total sales.
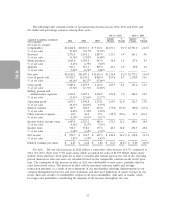
• Total sales in 2012 increased 8.2% over 2011. Sales in same-stores, over a comparable 52-week
period, increased 4.7%, with increases in both customer traffic and average transaction amount.
Consumables drove 83% of the total increase in sales with the most significant increases in
perishables, candy and snacks. Average sales per square foot in 2012 were $216, up from $213
(including a $4 contribution from the 53rd week) in 2011.
• Operating profit increased 11.0% to $1.66 billion, or 10.3% of sales, compared to $1.49 billion,
or 10.1% of sales in 2011. The improvement in our operating profit rate was attributable to a
25 basis-point reduction of SG&A and a 1 basis-point increase in our gross profit rate.
• We are pleased with our ability to manage our gross profit as consumables continued to increase
as a percentage of our overall sales mix. We continued to gain efficiencies in our transportation
network and had a lower LIFO charge; however, the markdown rate was higher in 2012,
primarily in apparel, and we experienced a modest increase in our shrink rate.
• The improvement in SG&A, as a percentage of sales, was due in large part to improved
utilization of store labor, partially offset by higher rent expense and higher fees associated with
debit card transactions. For other factors, see the detailed discussion that follows.
• Interest expense decreased by $77.0 million in 2012 to $127.9 million, as a result of lower
average interest rates on our outstanding long-term obligations and lower average debt balances
throughout the year. In 2012, we refinanced the remaining balance of our 11.875%/12.625%
senior subordinated notes, resulting in a non-operating charge of $29.0 million.
29