Dollar General 2012 Annual Report Download - page 49
Download and view the complete annual report
Please find page 49 of the 2012 Dollar General annual report below. You can navigate through the pages in the report by either clicking on the pages listed below, or by using the keyword search tool below to find specific information within the annual report.-
 1
1 -
2
-
3
-
4
-
5
-
6
-
7
-
8
-
9
-
10
-
11
-
12
-
13
-
14
-
15
-
16
-
17
-
18
-
19
-
20
-
21
-
22
-
23
-
24
-
25
-
26
-
27
-
28
-
29
-
30
-
31
-
32
-
33
-
34
-
35
-
36
-
37
-
38
-
 39
39 -
 40
40 -
 41
41 -
 42
42 -
 43
43 -
 44
44 -
 45
45 -
 46
46 -
 47
47 -
 48
48 -
 49
49 -
 50
50 -
 51
51 -
 52
52 -
 53
53 -
 54
54 -
 55
55 -
 56
56 -
 57
57 -
 58
58 -
 59
59 -
60
-
61
-
62
-
63
-
64
-
65
-
66
-
67
-
68
-
69
-
70
-
71
-
72
-
73
-
74
-
75
-
76
-
77
-
78
-
79
-
80
-
81
-
82
-
83
-
84
-
85
-
86
-
87
-
88
-
89
-
90
-
91
-
92
-
93
-
94
-
95
-
96
-
97
-
98
-
99
-
100
-
101
-
102
-
103
-
104
-
105
-
106
-
107
-
108
-
109
-
110
-
111
-
112
-
113
-
114
-
115
-
116
-
117
-
118
-
119
-
120
-
121
-
122
-
123
-
124
-
125
-
126
-
127
-
128
-
129
-
130
-
131
-
132
-
133
-
134
-
135
-
136
-
137
-
138
-
139
-
140
-
141
-
142
-
143
-
144
-
145
-
146
-
147
-
148
-
149
-
150
-
151
-
152
-
153
-
154
-
155
-
156
-
157
-
158
-
159
-
160
-
161
-
162
-
163
-
164
-
165
-
166
-
167
-
168
-
169
-
170
-
171
-
172
-
173
-
174
-
175
-
176
-
177
-
178
-
179
-
180
-
181
-
182
-
183
-
184
-
185
-
186
-
187
-
188
-
189
-
190
-
191
-
192
-
193
-
194
-
195
-
196
-
197
 |
 |

Proxy
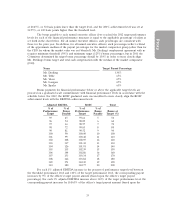
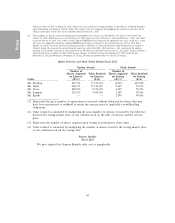
Grants of Plan-Based Awards in Fiscal 2012
The table below sets forth information regarding grants of plan-based awards to our named
executive officers for fiscal 2012. The awards listed under ‘‘Estimated Possible Payouts Under Equity
Incentive Plan Awards’’ include (1) for each of the named executive officers, the threshold, target and
maximum number of performance share units which may be earned by each named executive officer
based upon the level of achievement of financial performance measures for fiscal 2012; and (2) for
Mr. Dreiling, an additional award of performance-based restricted stock which he may earn based upon
achievement of financial performance measures for fiscal 2014 and 2015. The awards listed under ‘‘All
Other Option Awards’’ include non-qualified stock options that vest over time based upon the named
executive officer’s continued employment by our Company. All of the awards listed in this table were
granted pursuant to our Amended and Restated 2007 Stock Incentive Plan. See ‘‘Long-Term Equity
Incentive Program’’ in ‘‘Compensation Discussion & Analysis’’ above for further discussion of these
awards. We have omitted the column for All Other Stock Awards: Number of Shares of Stock or Units
because it is inapplicable.
The table below also sets forth each named executive officer’s annual Teamshare bonus
opportunity for fiscal 2012. Actual bonus amounts earned by each named executive officer for fiscal
2012 are set forth in the Summary Compensation Table above and represent prorated payments on a
graduated scale for financial performance between the threshold and target performance level. See
‘‘Short-Term Cash Incentive Plan’’ in ‘‘Compensation Discussion and Analysis’’ above for discussion of
the fiscal 2012 Teamshare program.
Grant
Exercise Date Fair
All Other Option or Base Value of
Estimated Possible Payouts Under Estimated Possible Payouts Under Awards: Number of Price of Stock and
Non-Equity Incentive Plan Awards Equity Incentive Plan Awards Securities Option Option
Grant Threshold Target Maximum Threshold Target Maximum Underlying Options Awards Awards
Name Date ($) ($) ($) (#) (#) (#) (#) ($/Sh)(1) ($)(2)
Mr. Dreiling — 806,725 1,613,450 5,000,000 — — — — — —
3/20/12 — — — — — — 228,226 45.25 3,091,549
3/20/12 — — — 19,904 39,807 79,614 — — 1,801,267
3/20/12 — — — 163,019 326,037 — — — 14,753,174
Mr. Tehle — 221,049 442,098 5,000,000 — — — — — —
3/20/12 — — — — — — 37,440 45.25 507,162
3/20/12 — — — 3,265 6,530 13,060 — — 295,483
Mr. Vasos — 213,696 427,391 5,000,000 — — — — — —
3/20/12 — — — — — — 37,440 45.25 507,162
3/20/12 — — — 3,265 6,530 13,060 — — 295,483
Ms. Lanigan — 180,577 361,154 5,000,000 — — — — — —
3/20/12 — — — — — — 37,440 45.25 507,162
3/20/12 — — — 3,265 6,530 13,060 — — 295,483
Mr. Sparks — 171,607 343,215 5,000,000 — — — — — —
3/20/12 — — — — — — 37,440 45.25 507,162
3/20/12 — — — 3,265 6,530 13,060 — — 295,483
(1) The per share exercise price was calculated based on the closing market price of one share of our common stock on the date of
grant as reported by the NYSE.
(2) Represents the aggregate grant date fair value of each equity award, computed in accordance with FASB ASC Topic 718. For equity
awards that are subject to performance conditions, the value at the grant date is based upon the probable outcome of such
conditions. For information regarding the assumptions made in the valuation of these awards, see Note 11 of the annual
consolidated financial statements included in our 2012 Form 10-K.
42