Dollar General 2012 Annual Report Download - page 165
Download and view the complete annual report
Please find page 165 of the 2012 Dollar General annual report below. You can navigate through the pages in the report by either clicking on the pages listed below, or by using the keyword search tool below to find specific information within the annual report.-
 1
1 -
2
-
3
-
4
-
5
-
6
-
7
-
8
-
9
-
10
-
11
-
12
-
13
-
14
-
15
-
16
-
17
-
18
-
19
-
20
-
21
-
22
-
23
-
24
-
25
-
26
-
27
-
28
-
29
-
30
-
31
-
32
-
33
-
34
-
35
-
36
-
37
-
38
-
39
-
40
-
41
-
42
-
43
-
44
-
45
-
46
-
47
-
48
-
49
-
50
-
51
-
52
-
53
-
54
-
55
-
56
-
57
-
58
-
59
-
60
-
61
-
62
-
63
-
64
-
65
-
66
-
67
-
68
-
69
-
70
-
71
-
72
-
73
-
74
-
75
-
76
-
77
-
78
-
79
-
80
-
81
-
82
-
83
-
84
-
85
-
86
-
87
-
88
-
89
-
90
-
91
-
92
-
93
-
94
-
95
-
96
-
97
-
98
-
99
-
100
-
101
-
102
-
103
-
104
-
105
-
106
-
107
-
108
-
109
-
110
-
111
-
112
-
113
-
114
-
115
-
116
-
117
-
118
-
119
-
120
-
121
-
122
-
123
-
124
-
125
-
126
-
127
-
128
-
129
-
130
-
131
-
132
-
133
-
134
-
135
-
136
-
137
-
138
-
139
-
140
-
141
-
142
-
143
-
144
-
145
-
146
-
147
-
148
-
149
-
150
-
151
-
152
-
153
-
154
-
 155
155 -
 156
156 -
 157
157 -
 158
158 -
 159
159 -
 160
160 -
 161
161 -
 162
162 -
 163
163 -
 164
164 -
 165
165 -
 166
166 -
 167
167 -
 168
168 -
 169
169 -
 170
170 -
 171
171 -
 172
172 -
 173
173 -
 174
174 -
 175
175 -
176
-
177
-
178
-
179
-
180
-
181
-
182
-
183
-
184
-
185
-
186
-
187
-
188
-
189
-
190
-
191
-
192
-
193
-
194
-
195
-
196
-
197
 |
 |

10-K
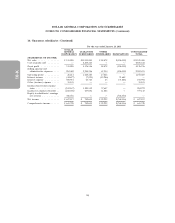
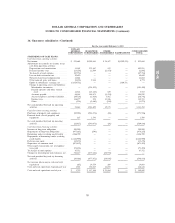
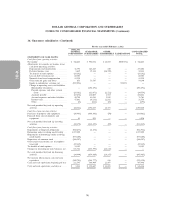
DOLLAR GENERAL CORPORATION AND SUBSIDIARIES
NOTES TO CONSOLIDATED FINANCIAL STATEMENTS (Continued)
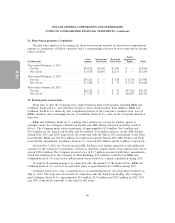
11. Share-based payments (Continued)
Performance Options, future compensation cost relating to unvested Performance Options will not be
recognized.
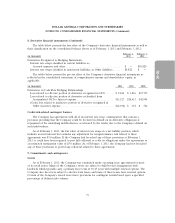
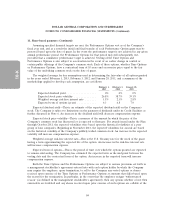
Other options include awards granted to employees and members of the board of directors and
generally vest solely upon the continued employment or board service of the recipient over a period of
four years for employees and three years for board members. A summary of other stock option activity
during the year ended February 1, 2013 is as follows:
Average Remaining
Options Exercise Contractual Intrinsic
(Intrinsic value amounts reflected in thousands) Issued Price Term in Years Value
Balance, February 3, 2012 ........... 217,137 $29.05
Granted ........................ 1,063,303 45.46
Exercised ....................... (8,532) 13.36
Canceled ....................... (60,137) 45.14
Balance, February 1, 2013 ........... 1,211,771 $42.77 8.9 $4,416
Exercisable at February 1, 2013 ....... 142,026 $28.76 7.3 $2,489
The weighted average grant date fair value of other options granted was $13.54 and $13.14 during
2012 and 2011, respectively. No other options were granted in 2010. The intrinsic value of other
options exercised during 2012, 2011 and 2010 was $0.3 million, $1.6 million and $15.5 million,
respectively.
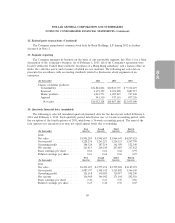
From time to time, the Company has issued share unit awards including restricted stock units and,
beginning in 2012, performance stock units. All nonvested performance stock unit and restricted stock
unit awards granted in the periods presented had a purchase price of zero. The nonvested performance
share unit and restricted stock unit awards granted under the plan generally vest ratably over a
three-year period, and, with limited exceptions, are automatically converted into shares of common
stock on the vesting date.
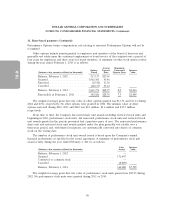
The number of performance stock unit awards issued is based upon the Company’s annual
financial performance as specified in the award agreement. A summary of performance stock unit
award activity during the year ended February 1, 2013 is as follows:
Units Intrinsic
(Intrinsic value amounts reflected in thousands) Issued Value
Balance, February 3, 2012 ............................. —
Granted .......................................... 171,497
Converted to common stock ........................... —
Canceled ......................................... (8,809)
Balance, February 1, 2013 ............................. 162,688 $7,529
The weighted average grant date fair value of performance stock units granted was $45.25 during
2012. No performance stock units were granted during 2011 or 2010.
86