Dollar General 2012 Annual Report Download - page 134
Download and view the complete annual report
Please find page 134 of the 2012 Dollar General annual report below. You can navigate through the pages in the report by either clicking on the pages listed below, or by using the keyword search tool below to find specific information within the annual report.-
 1
1 -
2
-
3
-
4
-
5
-
6
-
7
-
8
-
9
-
10
-
11
-
12
-
13
-
14
-
15
-
16
-
17
-
18
-
19
-
20
-
21
-
22
-
23
-
24
-
25
-
26
-
27
-
28
-
29
-
30
-
31
-
32
-
33
-
34
-
35
-
36
-
37
-
38
-
39
-
40
-
41
-
42
-
43
-
44
-
45
-
46
-
47
-
48
-
49
-
50
-
51
-
52
-
53
-
54
-
55
-
56
-
57
-
58
-
59
-
60
-
61
-
62
-
63
-
64
-
65
-
66
-
67
-
68
-
69
-
70
-
71
-
72
-
73
-
74
-
75
-
76
-
77
-
78
-
79
-
80
-
81
-
82
-
83
-
84
-
85
-
86
-
87
-
88
-
89
-
90
-
91
-
92
-
93
-
94
-
95
-
96
-
97
-
98
-
99
-
100
-
101
-
102
-
103
-
104
-
105
-
106
-
107
-
108
-
109
-
110
-
111
-
112
-
113
-
114
-
115
-
116
-
117
-
118
-
119
-
120
-
121
-
122
-
123
-
 124
124 -
 125
125 -
 126
126 -
 127
127 -
 128
128 -
 129
129 -
 130
130 -
 131
131 -
 132
132 -
 133
133 -
 134
134 -
 135
135 -
 136
136 -
 137
137 -
 138
138 -
 139
139 -
 140
140 -
 141
141 -
 142
142 -
 143
143 -
 144
144 -
145
-
146
-
147
-
148
-
149
-
150
-
151
-
152
-
153
-
154
-
155
-
156
-
157
-
158
-
159
-
160
-
161
-
162
-
163
-
164
-
165
-
166
-
167
-
168
-
169
-
170
-
171
-
172
-
173
-
174
-
175
-
176
-
177
-
178
-
179
-
180
-
181
-
182
-
183
-
184
-
185
-
186
-
187
-
188
-
189
-
190
-
191
-
192
-
193
-
194
-
195
-
196
-
197
 |
 |

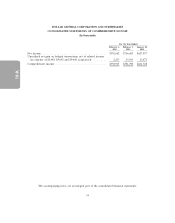
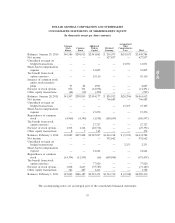
10-K
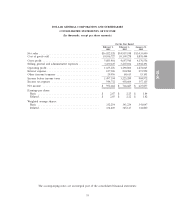
DOLLAR GENERAL CORPORATION AND SUBSIDIARIES
CONSOLIDATED STATEMENTS OF SHAREHOLDERS’ EQUITY
(In thousands except per share amounts)
Accumulated
Common Additional Other
Stock Common Paid-in Retained Comprehensive
Shares Stock Capital Earnings Loss Total
Balances, January 29, 2010 . 340,586 $298,013 $2,941,863 $ 203,075 $(34,167) $3,408,784
Net income ............ — — — 627,857 — 627,857
Unrealized net gain on
hedged transactions ..... — — — — 13,871 13,871
Share-based compensation
expense ............. — — 12,805 — — 12,805
Tax benefit from stock
option exercises ........ — — 10,110 — — 10,110
Issuance of common stock
under stock incentive
plans ............... 93 82 1,943 — — 2,025
Exercise of stock options . . . 872 763 (12,054) — — (11,291)
Other equity transactions . . (44) (39) (490) — — (529)
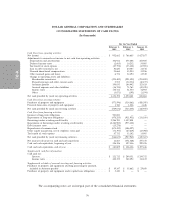
Balances, January 28, 2011 . 341,507 $298,819 $2,954,177 $ 830,932 $(20,296) $4,063,632
Net income ............ — — — 766,685 — 766,685
Unrealized net gain on
hedged transactions ..... — — — — 15,105 15,105
Share-based compensation
expense ............. — — 15,250 — — 15,250
Repurchases of common
stock ............... (4,960) (4,340) (1,558) (180,699) — (186,597)
Tax benefit from stock
option exercises ........ — — 27,727 — — 27,727
Exercise of stock options . . . 1,534 1,342 (28,734) — — (27,392)
Other equity transactions . . 8 7 165 — — 172
Balances, February 3, 2012 . 338,089 $295,828 $2,967,027 $1,416,918 $ (5,191) $4,674,582
Net income ............ — — — 952,662 — 952,662
Unrealized net gain on
hedged transactions ..... — — — — 2,253 2,253
Share-based compensation
expense ............. — — 21,664 — — 21,664
Repurchases of common
stock ............... (14,394) (12,595) (16) (658,848) — (671,459)
Tax benefit from stock
option exercises ........ — — 77,020 — — 77,020
Exercise of stock options . . . 3,048 2,667 (75,787) — — (73,120)
Other equity transactions . . 326 285 1,443 — — 1,728
Balances, February 1, 2013 . 327,069 $286,185 $2,991,351 $1,710,732 $ (2,938) $4,985,330
The accompanying notes are an integral part of the consolidated financial statements.
55