Dollar General 2012 Annual Report Download - page 137
Download and view the complete annual report
Please find page 137 of the 2012 Dollar General annual report below. You can navigate through the pages in the report by either clicking on the pages listed below, or by using the keyword search tool below to find specific information within the annual report.-
 1
1 -
2
-
3
-
4
-
5
-
6
-
7
-
8
-
9
-
10
-
11
-
12
-
13
-
14
-
15
-
16
-
17
-
18
-
19
-
20
-
21
-
22
-
23
-
24
-
25
-
26
-
27
-
28
-
29
-
30
-
31
-
32
-
33
-
34
-
35
-
36
-
37
-
38
-
39
-
40
-
41
-
42
-
43
-
44
-
45
-
46
-
47
-
48
-
49
-
50
-
51
-
52
-
53
-
54
-
55
-
56
-
57
-
58
-
59
-
60
-
61
-
62
-
63
-
64
-
65
-
66
-
67
-
68
-
69
-
70
-
71
-
72
-
73
-
74
-
75
-
76
-
77
-
78
-
79
-
80
-
81
-
82
-
83
-
84
-
85
-
86
-
87
-
88
-
89
-
90
-
91
-
92
-
93
-
94
-
95
-
96
-
97
-
98
-
99
-
100
-
101
-
102
-
103
-
104
-
105
-
106
-
107
-
108
-
109
-
110
-
111
-
112
-
113
-
114
-
115
-
116
-
117
-
118
-
119
-
120
-
121
-
122
-
123
-
124
-
125
-
126
-
 127
127 -
 128
128 -
 129
129 -
 130
130 -
 131
131 -
 132
132 -
 133
133 -
 134
134 -
 135
135 -
 136
136 -
 137
137 -
 138
138 -
 139
139 -
 140
140 -
 141
141 -
 142
142 -
 143
143 -
 144
144 -
 145
145 -
 146
146 -
 147
147 -
148
-
149
-
150
-
151
-
152
-
153
-
154
-
155
-
156
-
157
-
158
-
159
-
160
-
161
-
162
-
163
-
164
-
165
-
166
-
167
-
168
-
169
-
170
-
171
-
172
-
173
-
174
-
175
-
176
-
177
-
178
-
179
-
180
-
181
-
182
-
183
-
184
-
185
-
186
-
187
-
188
-
189
-
190
-
191
-
192
-
193
-
194
-
195
-
196
-
197
 |
 |

10-K
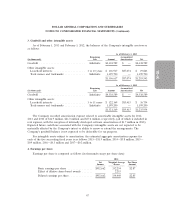
DOLLAR GENERAL CORPORATION AND SUBSIDIARIES
NOTES TO CONSOLIDATED FINANCIAL STATEMENTS (Continued)
1. Basis of presentation and accounting policies (Continued)
For the years ended February 1, 2013, February 3, 2012, and January 28, 2011, gross realized gains
and losses on the sales of available-for-sale securities were not material. The cost of securities sold is
based upon the specific identification method.
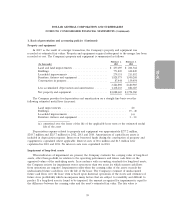
Merchandise inventories
Inventories are stated at the lower of cost or market with cost determined using the retail last-in,
first-out (‘‘LIFO’’) method as this method results in a better matching of costs and revenues. Under the
Company’s retail inventory method (‘‘RIM’’), the calculation of gross profit and the resulting valuation
of inventories at cost are computed by applying a calculated cost-to-retail inventory ratio to the retail
value of sales at a department level. Costs directly associated with warehousing and distribution are
capitalized into inventory. The excess of current cost over LIFO cost was approximately $101.9 million
and $100.5 million at February 1, 2013 and February 3, 2012, respectively. Current cost is determined
using the RIM on a first-in, first-out basis. Under the LIFO inventory method, the impacts of rising or
falling market price changes increase or decrease cost of sales (the LIFO provision or benefit). The
Company recorded a LIFO provision of $1.4 million in 2012, $47.7 million in 2011, and $5.3 million in
2010.
The 2011 LIFO provision was impacted by increased commodity costs related to food, housewares
and apparel products which were driven by increases in cotton, sugar, coffee, groundnut, resin,
petroleum and other raw material commodity costs. These costs were relatively stable in 2012 and 2010.
Vendor rebates
The Company accounts for all cash consideration received from vendors in accordance with
applicable accounting standards pertaining to such arrangements. Cash consideration received from a
vendor is generally presumed to be a rebate or an allowance and is accounted for as a reduction of
merchandise purchase costs as earned. However, certain specific, incremental and otherwise qualifying
SG&A expenses related to the promotion or sale of vendor products may be offset by cash
consideration received from vendors, in accordance with arrangements such as cooperative advertising,
when earned for dollar amounts up to but not exceeding actual incremental costs.
Prepaid expenses and other current assets
Prepaid expenses and other current assets include prepaid amounts for rent, maintenance,
advertising, and insurance, as well as amounts receivable for insurance related to a litigation settlement
discussed in greater detail in Note 9, and certain vendor rebates (primarily those expected to be
collected in cash) and coupons.
58