Dollar General 2012 Annual Report Download - page 147
Download and view the complete annual report
Please find page 147 of the 2012 Dollar General annual report below. You can navigate through the pages in the report by either clicking on the pages listed below, or by using the keyword search tool below to find specific information within the annual report.-
 1
1 -
2
-
3
-
4
-
5
-
6
-
7
-
8
-
9
-
10
-
11
-
12
-
13
-
14
-
15
-
16
-
17
-
18
-
19
-
20
-
21
-
22
-
23
-
24
-
25
-
26
-
27
-
28
-
29
-
30
-
31
-
32
-
33
-
34
-
35
-
36
-
37
-
38
-
39
-
40
-
41
-
42
-
43
-
44
-
45
-
46
-
47
-
48
-
49
-
50
-
51
-
52
-
53
-
54
-
55
-
56
-
57
-
58
-
59
-
60
-
61
-
62
-
63
-
64
-
65
-
66
-
67
-
68
-
69
-
70
-
71
-
72
-
73
-
74
-
75
-
76
-
77
-
78
-
79
-
80
-
81
-
82
-
83
-
84
-
85
-
86
-
87
-
88
-
89
-
90
-
91
-
92
-
93
-
94
-
95
-
96
-
97
-
98
-
99
-
100
-
101
-
102
-
103
-
104
-
105
-
106
-
107
-
108
-
109
-
110
-
111
-
112
-
113
-
114
-
115
-
116
-
117
-
118
-
119
-
120
-
121
-
122
-
123
-
124
-
125
-
126
-
127
-
128
-
129
-
130
-
131
-
132
-
133
-
134
-
135
-
136
-
 137
137 -
 138
138 -
 139
139 -
 140
140 -
 141
141 -
 142
142 -
 143
143 -
 144
144 -
 145
145 -
 146
146 -
 147
147 -
 148
148 -
 149
149 -
 150
150 -
 151
151 -
 152
152 -
 153
153 -
 154
154 -
 155
155 -
 156
156 -
 157
157 -
158
-
159
-
160
-
161
-
162
-
163
-
164
-
165
-
166
-
167
-
168
-
169
-
170
-
171
-
172
-
173
-
174
-
175
-
176
-
177
-
178
-
179
-
180
-
181
-
182
-
183
-
184
-
185
-
186
-
187
-
188
-
189
-
190
-
191
-
192
-
193
-
194
-
195
-
196
-
197
 |
 |

10-K
DOLLAR GENERAL CORPORATION AND SUBSIDIARIES
NOTES TO CONSOLIDATED FINANCIAL STATEMENTS (Continued)
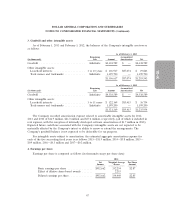
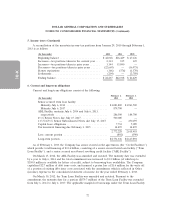
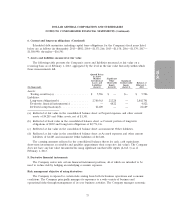
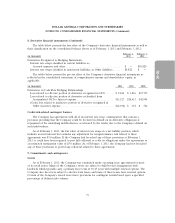
4. Earnings per share (Continued)
2011
Net Weighted Average Per Share
Income Shares Amount
Basic earnings per share ................ $766,685 341,234 $2.25
Effect of dilutive share-based awards ....... 3,883
Diluted earnings per share ............... $766,685 345,117 $2.22
2010
Net Weighted Average Per Share
Income Shares Amount
Basic earnings per share ................ $627,857 341,047 $1.84
Effect of dilutive share-based awards ....... 3,753
Diluted earnings per share ............... $627,857 344,800 $1.82
Basic earnings per share was computed by dividing net income by the weighted average number of
shares of common stock outstanding during the year. Diluted earnings per share was determined based
on the dilutive effect of share-based awards using the treasury stock method.
Options to purchase shares of common stock that were outstanding at the end of the respective
periods, but were not included in the computation of diluted earnings per share because the effect of
exercising such options would be antidilutive, were 0.8 million, zero and 0.4 million in 2012, 2011 and
2010, respectively.
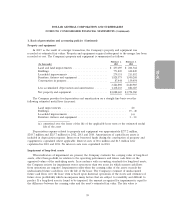
5. Income taxes
The provision (benefit) for income taxes consists of the following:
(In thousands) 2012 2011 2010
Current:
Federal ............................... $457,370 $385,277 $273,005
Foreign ............................... 1,209 1,449 1,269
State ................................ 78,025 56,272 28,062
536,604 442,998 302,336
Deferred:
Federal ............................... 9,734 8,313 42,024
State ................................ (1,606) 7,293 12,755
8,128 15,606 54,779
$544,732 $458,604 $357,115
68