Dollar General 2012 Annual Report Download - page 112
Download and view the complete annual report
Please find page 112 of the 2012 Dollar General annual report below. You can navigate through the pages in the report by either clicking on the pages listed below, or by using the keyword search tool below to find specific information within the annual report.-
 1
1 -
2
-
3
-
4
-
5
-
6
-
7
-
8
-
9
-
10
-
11
-
12
-
13
-
14
-
15
-
16
-
17
-
18
-
19
-
20
-
21
-
22
-
23
-
24
-
25
-
26
-
27
-
28
-
29
-
30
-
31
-
32
-
33
-
34
-
35
-
36
-
37
-
38
-
39
-
40
-
41
-
42
-
43
-
44
-
45
-
46
-
47
-
48
-
49
-
50
-
51
-
52
-
53
-
54
-
55
-
56
-
57
-
58
-
59
-
60
-
61
-
62
-
63
-
64
-
65
-
66
-
67
-
68
-
69
-
70
-
71
-
72
-
73
-
74
-
75
-
76
-
77
-
78
-
79
-
80
-
81
-
82
-
83
-
84
-
85
-
86
-
87
-
88
-
89
-
90
-
91
-
92
-
93
-
94
-
95
-
96
-
97
-
98
-
99
-
100
-
101
-
 102
102 -
 103
103 -
 104
104 -
 105
105 -
 106
106 -
 107
107 -
 108
108 -
 109
109 -
 110
110 -
 111
111 -
 112
112 -
 113
113 -
 114
114 -
 115
115 -
 116
116 -
 117
117 -
 118
118 -
 119
119 -
 120
120 -
 121
121 -
 122
122 -
123
-
124
-
125
-
126
-
127
-
128
-
129
-
130
-
131
-
132
-
133
-
134
-
135
-
136
-
137
-
138
-
139
-
140
-
141
-
142
-
143
-
144
-
145
-
146
-
147
-
148
-
149
-
150
-
151
-
152
-
153
-
154
-
155
-
156
-
157
-
158
-
159
-
160
-
161
-
162
-
163
-
164
-
165
-
166
-
167
-
168
-
169
-
170
-
171
-
172
-
173
-
174
-
175
-
176
-
177
-
178
-
179
-
180
-
181
-
182
-
183
-
184
-
185
-
186
-
187
-
188
-
189
-
190
-
191
-
192
-
193
-
194
-
195
-
196
-
197
 |
 |

10-K
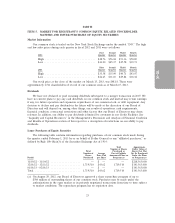
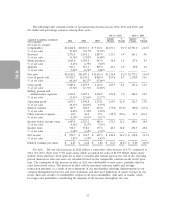
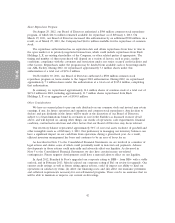
The net sales increase in 2011 reflects a same-store sales increase of 6.0% compared to 2010. For
2011, there were 9,254 same-stores which accounted for sales of $13.63 billion. Accordingly, the same
store sales percentage for 2011 excludes sales from the 53rd week as there was no comparable week in
2010. Net sales for the 53rd week of 2011 totaled $289.3 million. The remainder of the increase in sales
in 2011 was attributable to new stores, partially offset by sales from closed stores. The increase in sales
reflects increased customer traffic and average transaction amounts, which is the result of the continued
refinement of our merchandise offerings, the optimization of our category management processes,
further improvement in store standards, and an increase in sales prices resulting primarily from passing
through certain cost increases and increased utilization of square footage in our stores. Increases in
sales of consumables outpaced our non-consumables, with sales of packaged foods, snacks, beverages
and perishables, contributing the majority of the increase throughout the year.
Of our four major merchandise categories, the consumables category, which generally has a lower
gross profit rate than the other three categories, has grown most significantly over the past several
years. Because of the impact of sales mix on gross profit, we continually review our merchandise mix
and strive to adjust it when appropriate. Maintaining an appropriate sales mix is an integral part of
achieving our gross profit and sales goals. Both the number of customer transactions and average
transaction amount increased in 2012 and 2011, and we believe that our stores have benefited to some
degree from attracting new customers who are seeking value as a result of the challenging
macroeconomic environment in recent years.
Gross Profit. The gross profit rate as a percentage of sales was 31.7% in both 2012 and 2011.
Factors favorably impacting our gross profit rate include a significantly lower LIFO provision, higher
inventory markups, and improved transportation efficiencies due in part to a decrease in average miles
per delivery enabled by our new distribution centers and other logistics initiatives. These positive
factors were offset by higher markdowns, a reduction in price increases and a modest increase in our
inventory shrinkage rate compared to 2011. In addition, consumables, which generally have lower
markups than non-consumables, represented a greater percentage of sales in 2012 than in 2011. We
recorded a LIFO provision of $1.4 million in 2012 compared to a $47.7 million provision in 2011,
primarily as a result of lower inflation on commodities.
The gross profit rate as a percentage of sales was 31.7% in 2011 compared to 32.0% in 2010, a
decline of 31 basis points. Consumables also represented a greater percentage of sales in 2011 than in
2010. Our purchase costs increased primarily due to increased commodity costs. In addition, we
incurred higher markdowns and our transportation costs were impacted by higher fuel rates in 2011.
Our LIFO provision increased to $47.7 million in 2011 compared to $5.3 million in 2010. In 2011, our
mix of home and apparel merchandise decreased as percentage of sales and the gross profit rate within
these categories decreased due, in part, to higher markdowns. Factors positively affecting gross profit
include the selective price increases noted above as well as lower inventory shrinkage and distribution
center costs, as a percentage of sales.
SG&A Expense. SG&A expense was 21.4% as a percentage of sales in 2012 compared to 21.7%
in 2011, an improvement of 25 basis points. Retail labor expense increased at a lower rate than our
increase in sales, partially due to ongoing benefits of our workforce management system coupled with
savings due to various store work simplification initiatives. Also positively impacting SG&A was lower
legal settlement costs in 2012 due to two legal matters settled in 2011 for a combined expense of $13.1
million and the impact of decreased expenses ($2.9 million in 2012 compared to $11.1 million in 2011)
relating to secondary offerings of our common stock. Costs that increased at a rate higher than our
sales increase include rent expense, fees associated with the increased use of debit cards and
depreciation expense, primarily related to additions of certain store equipment and fixtures.
SG&A expense was 21.7% as a percentage of sales in 2011 compared to 22.3% in 2010, an
improvement of 61 basis points reflecting the favorable impact of the 13.6% increase in sales. In
33