Dollar General 2012 Annual Report Download - page 109
Download and view the complete annual report
Please find page 109 of the 2012 Dollar General annual report below. You can navigate through the pages in the report by either clicking on the pages listed below, or by using the keyword search tool below to find specific information within the annual report.-
 1
1 -
2
-
3
-
4
-
5
-
6
-
7
-
8
-
9
-
10
-
11
-
12
-
13
-
14
-
15
-
16
-
17
-
18
-
19
-
20
-
21
-
22
-
23
-
24
-
25
-
26
-
27
-
28
-
29
-
30
-
31
-
32
-
33
-
34
-
35
-
36
-
37
-
38
-
39
-
40
-
41
-
42
-
43
-
44
-
45
-
46
-
47
-
48
-
49
-
50
-
51
-
52
-
53
-
54
-
55
-
56
-
57
-
58
-
59
-
60
-
61
-
62
-
63
-
64
-
65
-
66
-
67
-
68
-
69
-
70
-
71
-
72
-
73
-
74
-
75
-
76
-
77
-
78
-
79
-
80
-
81
-
82
-
83
-
84
-
85
-
86
-
87
-
88
-
89
-
90
-
91
-
92
-
93
-
94
-
95
-
96
-
97
-
98
-
 99
99 -
 100
100 -
 101
101 -
 102
102 -
 103
103 -
 104
104 -
 105
105 -
 106
106 -
 107
107 -
 108
108 -
 109
109 -
 110
110 -
 111
111 -
 112
112 -
 113
113 -
 114
114 -
 115
115 -
 116
116 -
 117
117 -
 118
118 -
 119
119 -
120
-
121
-
122
-
123
-
124
-
125
-
126
-
127
-
128
-
129
-
130
-
131
-
132
-
133
-
134
-
135
-
136
-
137
-
138
-
139
-
140
-
141
-
142
-
143
-
144
-
145
-
146
-
147
-
148
-
149
-
150
-
151
-
152
-
153
-
154
-
155
-
156
-
157
-
158
-
159
-
160
-
161
-
162
-
163
-
164
-
165
-
166
-
167
-
168
-
169
-
170
-
171
-
172
-
173
-
174
-
175
-
176
-
177
-
178
-
179
-
180
-
181
-
182
-
183
-
184
-
185
-
186
-
187
-
188
-
189
-
190
-
191
-
192
-
193
-
194
-
195
-
196
-
197
 |
 |

10-K
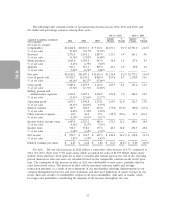
• We reported net income of $952.7 million, or $2.85 per diluted share, for fiscal 2012, compared
to net income of $766.7 million, or $2.22 per diluted share, for fiscal 2011.
• We generated approximately $1.13 billion of cash flows from operating activities in 2012, an
increase of 7.7% compared to 2011. We primarily utilized our cash flows from operating
activities to invest in our business and repurchase our common stock.
• During 2012 we opened 625 new stores, remodeled or relocated 592 stores, and closed 56 stores.
Also in 2012, we refinanced the remaining $451 million of our 11.875%/12.625% outstanding
senior subordinated notes with the issuance of $500 million of 4.125% senior notes due 2017, further
reducing interest expense and strengthening our financial position. Also in 2012, we repurchased
approximately 14.4 million shares of our outstanding common stock for $671.4 million.
In 2013, we plan to continue to focus on our four key operating priorities. We will continue to
refine and improve our store standards in an attempt to increase sales, focusing on maintaining a
consistent look and feel across the chain. Continued progress on improving our merchandise in-stock
position is an important element in improving overall customer service and increasing sales. As part of
our category management program, we plan to improve the square footage utilization in our legacy
stores that have not been converted to our current customer centric format in addition to expanding
our refrigerated food offerings in approximately 1,500 existing stores. We have initiatives underway to
increase our margins on many items within our consumables category, from which the majority of our
sales are generated. We plan to add approximately 320 new private brand consumables items during the
year and by the end of our second fiscal quarter, we expect to offer tobacco products in most of our
locations. We believe tobacco products will help drive additional sales through both increased traffic
and average transaction amount, although we expect these products to result in a reduction of our
gross profit rate. We also plan to continue to introduce new non-consumable products that we believe
will resonate with our customers’ needs and desires. We will continue our focused shrink reduction
efforts by employing our exception reporting tools, enhanced shrink optimization processes and
defensive merchandising fixtures. We will also continue to pursue global opportunities to directly source
a larger portion of our products, with the potential for significant savings to current costs, and to utilize
our overall purchasing expertise to reduce our domestic purchase costs.
We believe that there is opportunity to improve our inventory turns, and we are focused in 2013
on improved inventory management. Initiatives in process include operational efforts to optimize
presentation levels, improve in-stock levels, and enhance forecasting and allocation execution. We are
also in the process of implementing an improved supply chain solution to assist in promotional and
core inventory forecasting, ordering, monitoring and improving inventory visibility from purchase to
receipt to maintain efficient levels of inventory. Eventually, all of our SKUs will be managed through
the new supply chain solution. We expect this new supply chain solution to also improve several
processes in the stores which we believe will result in work simplification and enhance our view of
inventory levels in the supply chain.
With regard to leveraging information technology and process improvements to reduce costs, we
expect to gain further efficiencies with additional utilization of our workforce management systems and
improved store technology and communications capabilities. We will also seek to enhance our
procurement capabilities and take additional steps to augment our strong culture of cost reduction.
Finally, we are pleased with the performance of our 2012 new stores, remodels and relocations,
and in 2013 we plan to open 635 new stores and remodel or relocate an additional 550 stores.
Key Financial Metrics. We have identified the following as our most critical financial metrics:
• Same-store sales growth;
• Sales per square foot;
30