Dollar General 2012 Annual Report Download - page 135
Download and view the complete annual report
Please find page 135 of the 2012 Dollar General annual report below. You can navigate through the pages in the report by either clicking on the pages listed below, or by using the keyword search tool below to find specific information within the annual report.-
 1
1 -
2
-
3
-
4
-
5
-
6
-
7
-
8
-
9
-
10
-
11
-
12
-
13
-
14
-
15
-
16
-
17
-
18
-
19
-
20
-
21
-
22
-
23
-
24
-
25
-
26
-
27
-
28
-
29
-
30
-
31
-
32
-
33
-
34
-
35
-
36
-
37
-
38
-
39
-
40
-
41
-
42
-
43
-
44
-
45
-
46
-
47
-
48
-
49
-
50
-
51
-
52
-
53
-
54
-
55
-
56
-
57
-
58
-
59
-
60
-
61
-
62
-
63
-
64
-
65
-
66
-
67
-
68
-
69
-
70
-
71
-
72
-
73
-
74
-
75
-
76
-
77
-
78
-
79
-
80
-
81
-
82
-
83
-
84
-
85
-
86
-
87
-
88
-
89
-
90
-
91
-
92
-
93
-
94
-
95
-
96
-
97
-
98
-
99
-
100
-
101
-
102
-
103
-
104
-
105
-
106
-
107
-
108
-
109
-
110
-
111
-
112
-
113
-
114
-
115
-
116
-
117
-
118
-
119
-
120
-
121
-
122
-
123
-
124
-
 125
125 -
 126
126 -
 127
127 -
 128
128 -
 129
129 -
 130
130 -
 131
131 -
 132
132 -
 133
133 -
 134
134 -
 135
135 -
 136
136 -
 137
137 -
 138
138 -
 139
139 -
 140
140 -
 141
141 -
 142
142 -
 143
143 -
 144
144 -
 145
145 -
146
-
147
-
148
-
149
-
150
-
151
-
152
-
153
-
154
-
155
-
156
-
157
-
158
-
159
-
160
-
161
-
162
-
163
-
164
-
165
-
166
-
167
-
168
-
169
-
170
-
171
-
172
-
173
-
174
-
175
-
176
-
177
-
178
-
179
-
180
-
181
-
182
-
183
-
184
-
185
-
186
-
187
-
188
-
189
-
190
-
191
-
192
-
193
-
194
-
195
-
196
-
197
 |
 |

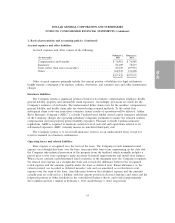
10-K
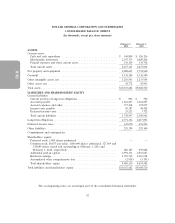
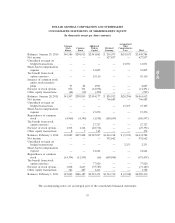
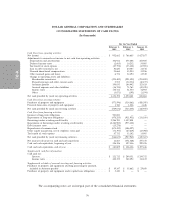
DOLLAR GENERAL CORPORATION AND SUBSIDIARIES
CONSOLIDATED STATEMENTS OF CASH FLOWS
(In thousands)
For the Year Ended
February 1, February 3, January 28,
2013 2012 2011
Cash flows from operating activities:
Net income ............................................. $ 952,662 $ 766,685 $ 627,857
Adjustments to reconcile net income to net cash from operating activities:
Depreciation and amortization ............................... 302,911 275,408 254,927
Deferred income taxes .................................... (2,605) 10,232 50,985
Tax benefit of stock options ................................. (87,752) (33,102) (13,905)
Loss on debt retirement, net ................................ 30,620 60,303 14,576
Noncash share-based compensation ............................ 21,664 15,250 15,956
Other noncash gains and losses .............................. 6,774 54,190 13,549
Change in operating assets and liabilities:
Merchandise inventories .................................. (391,409) (291,492) (251,809)
Prepaid expenses and other current assets ...................... 5,553 (34,554) (10,157)
Accounts payable ...................................... 194,035 104,442 123,424
Accrued expenses and other liabilities ......................... (36,741) 71,763 (42,428)
Income taxes ......................................... 138,711 51,550 42,903
Other .............................................. (3,071) (195) (1,194)
Net cash provided by (used in) operating activities ................... 1,131,352 1,050,480 824,684
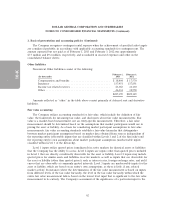
Cash flows from investing activities:
Purchases of property and equipment ............................ (571,596) (514,861) (420,395)
Proceeds from sales of property and equipment ..................... 1,760 1,026 1,448
Net cash provided by (used in) investing activities .................... (569,836) (513,835) (418,947)
Cash flows from financing activities:
Issuance of long-term obligations ............................... 500,000 — —
Repayments of long-term obligations ............................ (478,255) (911,951) (131,180)
Borrowings under revolving credit facility ......................... 2,286,700 1,157,800 —
Repayments of borrowings under revolving credit facility ............... (2,184,900) (973,100) —
Debt issuance costs ........................................ (15,278) — —
Repurchases of common stock ................................. (671,459) (186,597) —
Other equity transactions, net of employee taxes paid ................. (71,393) (27,219) (13,092)
Tax benefit of stock options .................................. 87,752 33,102 13,905
Net cash provided by (used in) financing activities .................... (546,833) (907,965) (130,367)
Net increase (decrease) in cash and cash equivalents .................. 14,683 (371,320) 275,370
Cash and cash equivalents, beginning of year ....................... 126,126 497,446 222,076
Cash and cash equivalents, end of year ........................... $ 140,809 $ 126,126 $ 497,446
Supplemental cash flow information:
Cash paid for:
Interest ............................................. $ 121,712 $ 209,351 $ 244,752
Income taxes ......................................... 422,333 382,294 314,123
Supplemental schedule of noncash investing and financing activities:
Purchases of property and equipment awaiting processing for payment,
included in Accounts payable ................................ $ 39,147 $ 35,662 $ 29,658
Purchases of property and equipment under capital lease obligations ....... $ 3,440 $ — $ —
The accompanying notes are an integral part of the consolidated financial statements.
56