Dollar General 2012 Annual Report Download - page 113
Download and view the complete annual report
Please find page 113 of the 2012 Dollar General annual report below. You can navigate through the pages in the report by either clicking on the pages listed below, or by using the keyword search tool below to find specific information within the annual report.-
 1
1 -
2
-
3
-
4
-
5
-
6
-
7
-
8
-
9
-
10
-
11
-
12
-
13
-
14
-
15
-
16
-
17
-
18
-
19
-
20
-
21
-
22
-
23
-
24
-
25
-
26
-
27
-
28
-
29
-
30
-
31
-
32
-
33
-
34
-
35
-
36
-
37
-
38
-
39
-
40
-
41
-
42
-
43
-
44
-
45
-
46
-
47
-
48
-
49
-
50
-
51
-
52
-
53
-
54
-
55
-
56
-
57
-
58
-
59
-
60
-
61
-
62
-
63
-
64
-
65
-
66
-
67
-
68
-
69
-
70
-
71
-
72
-
73
-
74
-
75
-
76
-
77
-
78
-
79
-
80
-
81
-
82
-
83
-
84
-
85
-
86
-
87
-
88
-
89
-
90
-
91
-
92
-
93
-
94
-
95
-
96
-
97
-
98
-
99
-
100
-
101
-
102
-
 103
103 -
 104
104 -
 105
105 -
 106
106 -
 107
107 -
 108
108 -
 109
109 -
 110
110 -
 111
111 -
 112
112 -
 113
113 -
 114
114 -
 115
115 -
 116
116 -
 117
117 -
 118
118 -
 119
119 -
 120
120 -
 121
121 -
 122
122 -
 123
123 -
124
-
125
-
126
-
127
-
128
-
129
-
130
-
131
-
132
-
133
-
134
-
135
-
136
-
137
-
138
-
139
-
140
-
141
-
142
-
143
-
144
-
145
-
146
-
147
-
148
-
149
-
150
-
151
-
152
-
153
-
154
-
155
-
156
-
157
-
158
-
159
-
160
-
161
-
162
-
163
-
164
-
165
-
166
-
167
-
168
-
169
-
170
-
171
-
172
-
173
-
174
-
175
-
176
-
177
-
178
-
179
-
180
-
181
-
182
-
183
-
184
-
185
-
186
-
187
-
188
-
189
-
190
-
191
-
192
-
193
-
194
-
195
-
196
-
197
 |
 |

10-K
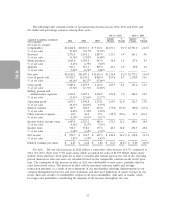
addition, retail labor expense increased at a rate lower than our increase in sales, partially due to the
rollout of our workforce management system. A decrease in incentive compensation driven by more
aggressive bonus targets, and various cost reduction efforts affecting rent, benefits, electricity and other
power costs, among other expenses, also contributed to the overall decrease in SG&A as a percentage
of sales. Costs that increased at a rate higher than our increase in sales included those associated with
a high speed store data network rollout, depreciation and amortization expense, and fees associated
with the increased use of debit cards. Depreciation and amortization increases were primarily due to
investments in the store data network and store properties purchased. SG&A in 2010 includes expenses
totaling $19.7 million for expenses (primarily share-based compensation) incurred in connection with
secondary offerings of our common stock.
Interest Expense. The decrease in interest expense in 2012 compared to 2011 is due to lower
average outstanding long-term obligations, resulting from our repurchases and refinancing of
indebtedness in 2012 and 2011 and lower all-in interest rates on our long-term obligations. See
Liquidity and Capital Resources below for further discussion.
The decrease in interest expense in 2011 compared to 2010 was primarily the result of lower
average outstanding long-term obligations and lower average interest rates due to the redemption of
our senior notes due 2015 with cash and borrowings under our revolving credit facility in the first half
of 2011 and lower all-in interest rates on our term loan, primarily due to reduced notional amounts on
our interest rate swaps.
We had outstanding variable-rate debt of $1.39 billion and $1.63 billion as of February 1, 2013 and
February 3, 2012, respectively, after taking into consideration the impact of interest rate swaps. The
remainder of our outstanding indebtedness at February 1, 2013 and February 3, 2012 was fixed rate
debt.
See the detailed discussion under ‘‘Liquidity and Capital Resources’’ regarding repurchases and
refinancing of various long-term obligations and the related effect on interest expense in the periods
presented.
Other (Income) Expense. In 2012, we recorded pretax losses of $29.0 million resulting from
repurchases of $450.7 million aggregate principal amount of our Senior Subordinated Notes plus
accrued and unpaid interest.
In 2011, we recorded pretax losses of $60.3 million resulting from repurchases of $864.3 million
aggregate principal amount of our senior notes due 2015 plus accrued and unpaid interest.
In 2010, we recorded pretax losses of $14.7 million resulting from the repurchase in the open
market of $115.0 million aggregate principal amount of our senior notes due 2015 plus accrued and
unpaid interest.
Income Taxes. The effective income tax rates for 2012, 2011, and 2010 were expenses of 36.4%,
37.4%, and 36.3%, respectively.
The 2012 effective tax rate of 36.4% was greater than the statutory tax rate of 35% due primarily
to the inclusion of state income taxes in the total effective tax rate. The 2012 effective tax rate of
36.4% was lower than the 2011 rate of 37.4% due primarily to the favorable resolution of a federal
income tax examination during 2012.
The 2011 effective tax rate of 37.4% was greater than the statutory tax rate of 35% due primarily
to the inclusion of state income taxes in the total effective tax rate. The 2011 effective rate was greater
than the 2010 rate of 36.3% primarily due to the effective resolution of various examinations by the
taxing authorities in 2010 that did not reoccur, to the same extent, in 2011. These factors resulted in
rate increases in 2011, as compared to 2010, associated with state income taxes and income tax related
interest expense. Increases in federal jobs related tax credits, primarily due to the Hire Act’s Retention
Credit, reduced the effective rate in 2011 as compared to 2010. The Retention Credit was only effective
for 2011.
34