Dollar General 2012 Annual Report Download - page 168
Download and view the complete annual report
Please find page 168 of the 2012 Dollar General annual report below. You can navigate through the pages in the report by either clicking on the pages listed below, or by using the keyword search tool below to find specific information within the annual report.-
 1
1 -
2
-
3
-
4
-
5
-
6
-
7
-
8
-
9
-
10
-
11
-
12
-
13
-
14
-
15
-
16
-
17
-
18
-
19
-
20
-
21
-
22
-
23
-
24
-
25
-
26
-
27
-
28
-
29
-
30
-
31
-
32
-
33
-
34
-
35
-
36
-
37
-
38
-
39
-
40
-
41
-
42
-
43
-
44
-
45
-
46
-
47
-
48
-
49
-
50
-
51
-
52
-
53
-
54
-
55
-
56
-
57
-
58
-
59
-
60
-
61
-
62
-
63
-
64
-
65
-
66
-
67
-
68
-
69
-
70
-
71
-
72
-
73
-
74
-
75
-
76
-
77
-
78
-
79
-
80
-
81
-
82
-
83
-
84
-
85
-
86
-
87
-
88
-
89
-
90
-
91
-
92
-
93
-
94
-
95
-
96
-
97
-
98
-
99
-
100
-
101
-
102
-
103
-
104
-
105
-
106
-
107
-
108
-
109
-
110
-
111
-
112
-
113
-
114
-
115
-
116
-
117
-
118
-
119
-
120
-
121
-
122
-
123
-
124
-
125
-
126
-
127
-
128
-
129
-
130
-
131
-
132
-
133
-
134
-
135
-
136
-
137
-
138
-
139
-
140
-
141
-
142
-
143
-
144
-
145
-
146
-
147
-
148
-
149
-
150
-
151
-
152
-
153
-
154
-
155
-
156
-
157
-
 158
158 -
 159
159 -
 160
160 -
 161
161 -
 162
162 -
 163
163 -
 164
164 -
 165
165 -
 166
166 -
 167
167 -
 168
168 -
 169
169 -
 170
170 -
 171
171 -
 172
172 -
 173
173 -
 174
174 -
 175
175 -
 176
176 -
 177
177 -
 178
178 -
179
-
180
-
181
-
182
-
183
-
184
-
185
-
186
-
187
-
188
-
189
-
190
-
191
-
192
-
193
-
194
-
195
-
196
-
197
 |
 |

10-K
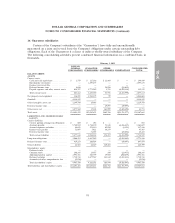
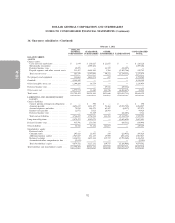
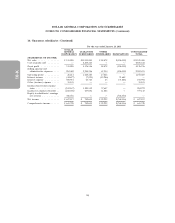
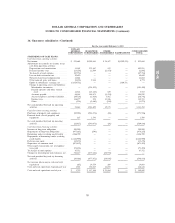
DOLLAR GENERAL CORPORATION AND SUBSIDIARIES
NOTES TO CONSOLIDATED FINANCIAL STATEMENTS (Continued)
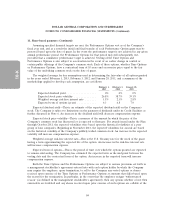
12. Related party transactions (Continued)
The Company repurchased common stock held by Buck Holdings, L.P during 2012 as further
discussed in Note 2.
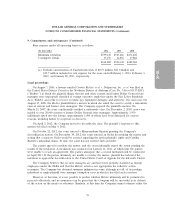
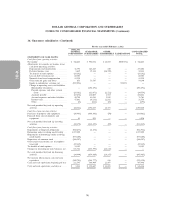
13. Segment reporting
The Company manages its business on the basis of one reportable segment. See Note 1 for a brief
description of the Company’s business. As of February 1, 2013, all of the Company’s operations were
located within the United States with the exception of a Hong Kong subsidiary, and a liaison office in
India, the collective assets and revenues of which are not material. The following net sales data is
presented in accordance with accounting standards related to disclosures about segments of an
enterprise.
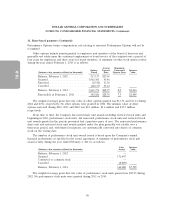
(In thousands) 2012 2011 2010
Classes of similar products:
Consumables .................... $11,844,846 $10,833,735 $ 9,332,119
Seasonal ........................ 2,172,399 2,051,098 1,887,917
Home products ................... 1,061,573 1,005,219 917,638
Apparel ........................ 943,310 917,136 897,326
Net sales ...................... $16,022,128 $14,807,188 $13,035,000
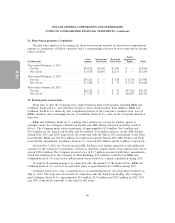
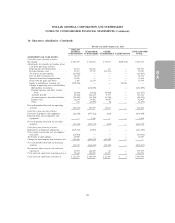
14. Quarterly financial data (unaudited)
The following is selected unaudited quarterly financial data for the fiscal years ended February 1,
2013 and February 3, 2012. Each quarterly period listed below was a 13-week accounting period, with
the exception of the fourth quarter of 2011, which was a 14-week accounting period. The sum of the
four quarters for any given year may not equal annual totals due to rounding.
First Second Third Fourth
(In thousands) Quarter Quarter Quarter Quarter
2012:
Net sales .................. $3,901,205 $3,948,655 $3,964,647 $4,207,621
Gross profit ................ 1,228,256 1,263,223 1,226,123 1,367,799
Operating profit ............. 384,324 387,214 361,389 522,349
Net income ................ 213,415 214,140 207,685 317,422
Basic earnings per share ....... 0.64 0.64 0.62 0.97
Diluted earnings per share ..... 0.63 0.64 0.62 0.97
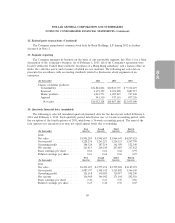
First Second Third Fourth
(In thousands) Quarter Quarter Quarter Quarter
2011:
Net sales .................. $3,451,697 $3,575,194 $3,595,224 $4,185,073
Gross profit ................ 1,087,397 1,148,342 1,115,802 1,346,369
Operating profit ............. 321,618 350,029 310,917 508,240
Net income ................ 156,969 146,042 171,164 292,510
Basic earnings per share ....... 0.46 0.43 0.50 0.86
Diluted earnings per share ..... 0.45 0.42 0.50 0.85
89