Dollar General 2012 Annual Report Download - page 37
Download and view the complete annual report
Please find page 37 of the 2012 Dollar General annual report below. You can navigate through the pages in the report by either clicking on the pages listed below, or by using the keyword search tool below to find specific information within the annual report.-
 1
1 -
2
-
3
-
4
-
5
-
6
-
7
-
8
-
9
-
10
-
11
-
12
-
13
-
14
-
15
-
16
-
17
-
18
-
19
-
20
-
21
-
22
-
23
-
24
-
25
-
26
-
 27
27 -
 28
28 -
 29
29 -
 30
30 -
 31
31 -
 32
32 -
 33
33 -
 34
34 -
 35
35 -
 36
36 -
 37
37 -
 38
38 -
 39
39 -
 40
40 -
 41
41 -
 42
42 -
 43
43 -
 44
44 -
 45
45 -
 46
46 -
 47
47 -
48
-
49
-
50
-
51
-
52
-
53
-
54
-
55
-
56
-
57
-
58
-
59
-
60
-
61
-
62
-
63
-
64
-
65
-
66
-
67
-
68
-
69
-
70
-
71
-
72
-
73
-
74
-
75
-
76
-
77
-
78
-
79
-
80
-
81
-
82
-
83
-
84
-
85
-
86
-
87
-
88
-
89
-
90
-
91
-
92
-
93
-
94
-
95
-
96
-
97
-
98
-
99
-
100
-
101
-
102
-
103
-
104
-
105
-
106
-
107
-
108
-
109
-
110
-
111
-
112
-
113
-
114
-
115
-
116
-
117
-
118
-
119
-
120
-
121
-
122
-
123
-
124
-
125
-
126
-
127
-
128
-
129
-
130
-
131
-
132
-
133
-
134
-
135
-
136
-
137
-
138
-
139
-
140
-
141
-
142
-
143
-
144
-
145
-
146
-
147
-
148
-
149
-
150
-
151
-
152
-
153
-
154
-
155
-
156
-
157
-
158
-
159
-
160
-
161
-
162
-
163
-
164
-
165
-
166
-
167
-
168
-
169
-
170
-
171
-
172
-
173
-
174
-
175
-
176
-
177
-
178
-
179
-
180
-
181
-
182
-
183
-
184
-
185
-
186
-
187
-
188
-
189
-
190
-
191
-
192
-
193
-
194
-
195
-
196
-
197
 |
 |

Proxy
Use of Market Benchmarking Data. We pay compensation that is competitive with the external
market for executive talent to attract and retain named executive officers who we believe will help
improve our business. We believe that this primary talent market consists of retail companies with
revenues both larger and smaller than ours and with business models similar to ours. Those companies
are likely to have executive positions comparable in breadth, complexity and scope of responsibility to
ours. Our market comparator group for 2012 compensation decisions consisted of AutoZone, Big Lots,
Family Dollar, McDonald’s, OfficeMax, PetSmart, Staples, J.C. Penney, The Gap, Macy’s, Ross Stores,
TJX Companies, Kohls, Starbucks, Limited Brands, Dollar Tree, Foot Locker, Safeway and Yum
Brands.
The market comparator group was modified in August 2011 by removing 7-Eleven, Collective
Brands, Genuine Parts, Nordstrom, Blockbuster, and The Pantry and adding TJX Companies, Kohls,
Starbucks, Limited Brands, Dollar Tree, Foot Locker and Safeway. We modified our market
comparator group for 2012 to reposition the Company at the median of the group in terms of
revenues, to ensure that the constituent companies more closely represent the retail companies with
which we compete for executive talent, and to ensure that the group continues to include companies
whose business models are similar to ours. However, we continued to use the 2011 market comparator
group as a reference point in our 2012 base salary and short-term incentive decisions (other than for
the CEO), as described below.
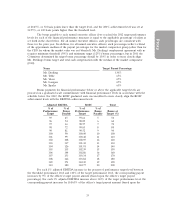
For 2012 base salary and short-term cash incentive compensation decisions for the named
executive officers, the Company averaged market data obtained from the most recently available
proxies of the 2012 market comparator group, from a survey of our 2012 market comparator group
conducted by Equilar and from a similar ‘‘aging’’ process of the data obtained in 2010 for the members
of the 2011 market comparator group, aged an additional 2.7%, consistent with the Company’s overall
2012 budget for merit increases. However, in the case of the CEO, the 2011 market comparator group
data was not used; instead, to ensure the Compensation Committee was aware of any significant
movement in CEO compensation levels within the market comparator group, Meridian provided survey
data from the 2012 market comparator group. These three market data sources were averaged in order
to reduce reliance on any one data source and to smooth out anomalies that might exist in the actual
individual position data reported by the market data source.
For 2013 compensation decisions regarding base salary, short-term cash incentives and long
term equity grant dollar values, the Committee reviewed survey data provided by Meridian from the
2012 market comparator group and referenced compensation data from the previous three years of the
proxy statements of the 2012 market comparator group for those positions where comparable positions
could be identified.
The Committee believes that the median of the competitive market generally is the appropriate
target for a named executive officer’s total compensation.
Elements of Named Executive Officer Compensation
We provide compensation in the form of base salary, short-term cash incentives, long-term
equity incentives, benefits and perquisites. We believe each of these elements is a necessary component
of the total compensation package and is consistent with compensation programs at competing
companies.
Base Salary. Base salary promotes the recruiting and retention functions of our compensation
program by reflecting the salaries for comparable positions in the competitive marketplace, rewarding
strong performance, and providing a stable and predictable income source for our executives. Because
we likely would be unable to attract or retain quality named executive officers in the absence of
competitive base salary levels, this component constitutes a significant portion of the total
compensation package. Our employment agreements with the named executive officers set forth
minimum base salary levels, but the Compensation Committee retains sole discretion to increase these
levels from time to time.
30