Dollar General 2012 Annual Report Download - page 105
Download and view the complete annual report
Please find page 105 of the 2012 Dollar General annual report below. You can navigate through the pages in the report by either clicking on the pages listed below, or by using the keyword search tool below to find specific information within the annual report.-
 1
1 -
2
-
3
-
4
-
5
-
6
-
7
-
8
-
9
-
10
-
11
-
12
-
13
-
14
-
15
-
16
-
17
-
18
-
19
-
20
-
21
-
22
-
23
-
24
-
25
-
26
-
27
-
28
-
29
-
30
-
31
-
32
-
33
-
34
-
35
-
36
-
37
-
38
-
39
-
40
-
41
-
42
-
43
-
44
-
45
-
46
-
47
-
48
-
49
-
50
-
51
-
52
-
53
-
54
-
55
-
56
-
57
-
58
-
59
-
60
-
61
-
62
-
63
-
64
-
65
-
66
-
67
-
68
-
69
-
70
-
71
-
72
-
73
-
74
-
75
-
76
-
77
-
78
-
79
-
80
-
81
-
82
-
83
-
84
-
85
-
86
-
87
-
88
-
89
-
90
-
91
-
92
-
93
-
94
-
 95
95 -
 96
96 -
 97
97 -
 98
98 -
 99
99 -
 100
100 -
 101
101 -
 102
102 -
 103
103 -
 104
104 -
 105
105 -
 106
106 -
 107
107 -
 108
108 -
 109
109 -
 110
110 -
 111
111 -
 112
112 -
 113
113 -
 114
114 -
 115
115 -
116
-
117
-
118
-
119
-
120
-
121
-
122
-
123
-
124
-
125
-
126
-
127
-
128
-
129
-
130
-
131
-
132
-
133
-
134
-
135
-
136
-
137
-
138
-
139
-
140
-
141
-
142
-
143
-
144
-
145
-
146
-
147
-
148
-
149
-
150
-
151
-
152
-
153
-
154
-
155
-
156
-
157
-
158
-
159
-
160
-
161
-
162
-
163
-
164
-
165
-
166
-
167
-
168
-
169
-
170
-
171
-
172
-
173
-
174
-
175
-
176
-
177
-
178
-
179
-
180
-
181
-
182
-
183
-
184
-
185
-
186
-
187
-
188
-
189
-
190
-
191
-
192
-
193
-
194
-
195
-
196
-
197
 |
 |

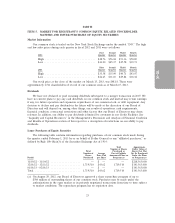
10-K
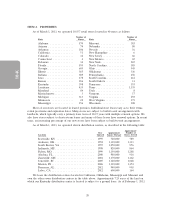
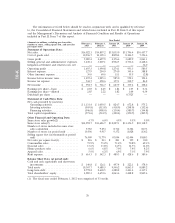
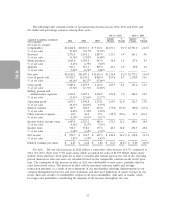
The information set forth below should be read in conjunction with, and is qualified by reference
to, the Consolidated Financial Statements and related notes included in Part II, Item 8 of this report
and the Management’s Discussion and Analysis of Financial Condition and Results of Operations
included in Part II, Item 7 of this report.
Year Ended
(Amounts in millions, excluding per share data, February 1, February 3, January 28, January 29, January 30,
number of stores, selling square feet, and net sales 2013 2012(1) 2011 2010 2009
per square foot)
Statement of Operations Data:
Net sales .......................... $16,022.1 $14,807.2 $13,035.0 $11,796.4 $10,457.7
Cost of goods sold ................... 10,936.7 10,109.3 8,858.4 8,106.5 7,396.6
Gross profit ........................ 5,085.4 4,697.9 4,176.6 3,689.9 3,061.1
Selling, general and administrative expenses . 3,430.1 3,207.1 2,902.5 2,736.6 2,448.6
Litigation settlement and related costs, net . — — — — 32.0
Operating profit .................... 1,655.3 1,490.8 1,274.1 953.3 580.5
Interest expense ..................... 127.9 204.9 274.0 345.6 388.8
Other (income) expense ............... 30.0 60.6 15.1 55.5 (2.8)
Income before income taxes ............ 1,497.4 1,225.3 985.0 552.1 194.4
Income tax expense .................. 544.7 458.6 357.1 212.7 86.2
Net income ........................ $ 952.7 $ 766.7 $ 627.9 $ 339.4 $ 108.2
Earnings per share—basic ............. $ 2.87 $ 2.25 $ 1.84 $ 1.05 $ 0.34
Earnings per share—diluted ............ 2.85 2.22 1.82 1.04 0.34
Dividends per share .................. — — — 0.7525 —
Statement of Cash Flows Data:
Net cash provided by (used in):
Operating activities ................. $ 1,131.4 $ 1,050.5 $ 824.7 $ 672.8 $ 575.2
Investing activities ................. (569.8) (513.8) (418.9) (248.0) (152.6)
Financing activities ................. (546.8) (908.0) (130.4) (580.7) (144.8)
Total capital expenditures .............. (571.6) (514.9) (420.4) (250.7) (205.5)
Other Financial and Operating Data:
Same store sales growth(2) ............. 4.7% 6.0% 4.9% 9.5% 9.0%
Same store sales(2) .................. $14,992.7 $13,626.7 $12,227.1 $11,356.5 $10,118.5
Number of stores included in same store
sales calculation ................... 9,783 9,254 8,712 8,324 8,153
Number of stores (at period end) ........ 10,506 9,937 9,372 8,828 8,362
Selling square feet (in thousands at period
end) ........................... 76,909 71,774 67,094 62,494 58,803
Net sales per square foot(3) ............ $ 216 $ 213 $ 201 $ 195 $ 180
Consumables sales ................... 73.9% 73.2% 71.6% 70.8% 69.3%
Seasonal sales ...................... 13.6% 13.8% 14.5% 14.5% 14.6%
Home products sales ................. 6.6% 6.8% 7.0% 7.4% 8.2%
Apparel sales ....................... 5.9% 6.2% 6.9% 7.3% 7.9%
Rent expense ....................... $ 614.3 $ 542.3 $ 489.3 $ 428.6 $ 389.6
Balance Sheet Data (at period end):
Cash and cash equivalents and short-term
investments ...................... $ 140.8 $ 126.1 $ 497.4 $ 222.1 $ 378.0
Total assets ........................ 10,367.7 9,688.5 9,546.2 8,863.5 8,889.2
Long-term debt ..................... 2,772.2 2,618.5 3,288.2 3,403.4 4,137.1
Total shareholders’ equity .............. 4,985.3 4,674.6 4,063.6 3,408.8 2,845.6
(1) The fiscal year ended February 3, 2012 was comprised of 53 weeks.
26