Dollar General 2012 Annual Report Download - page 136
Download and view the complete annual report
Please find page 136 of the 2012 Dollar General annual report below. You can navigate through the pages in the report by either clicking on the pages listed below, or by using the keyword search tool below to find specific information within the annual report.-
 1
1 -
2
-
3
-
4
-
5
-
6
-
7
-
8
-
9
-
10
-
11
-
12
-
13
-
14
-
15
-
16
-
17
-
18
-
19
-
20
-
21
-
22
-
23
-
24
-
25
-
26
-
27
-
28
-
29
-
30
-
31
-
32
-
33
-
34
-
35
-
36
-
37
-
38
-
39
-
40
-
41
-
42
-
43
-
44
-
45
-
46
-
47
-
48
-
49
-
50
-
51
-
52
-
53
-
54
-
55
-
56
-
57
-
58
-
59
-
60
-
61
-
62
-
63
-
64
-
65
-
66
-
67
-
68
-
69
-
70
-
71
-
72
-
73
-
74
-
75
-
76
-
77
-
78
-
79
-
80
-
81
-
82
-
83
-
84
-
85
-
86
-
87
-
88
-
89
-
90
-
91
-
92
-
93
-
94
-
95
-
96
-
97
-
98
-
99
-
100
-
101
-
102
-
103
-
104
-
105
-
106
-
107
-
108
-
109
-
110
-
111
-
112
-
113
-
114
-
115
-
116
-
117
-
118
-
119
-
120
-
121
-
122
-
123
-
124
-
125
-
 126
126 -
 127
127 -
 128
128 -
 129
129 -
 130
130 -
 131
131 -
 132
132 -
 133
133 -
 134
134 -
 135
135 -
 136
136 -
 137
137 -
 138
138 -
 139
139 -
 140
140 -
 141
141 -
 142
142 -
 143
143 -
 144
144 -
 145
145 -
 146
146 -
147
-
148
-
149
-
150
-
151
-
152
-
153
-
154
-
155
-
156
-
157
-
158
-
159
-
160
-
161
-
162
-
163
-
164
-
165
-
166
-
167
-
168
-
169
-
170
-
171
-
172
-
173
-
174
-
175
-
176
-
177
-
178
-
179
-
180
-
181
-
182
-
183
-
184
-
185
-
186
-
187
-
188
-
189
-
190
-
191
-
192
-
193
-
194
-
195
-
196
-
197
 |
 |

10-K
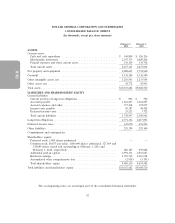
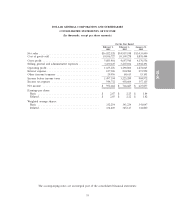
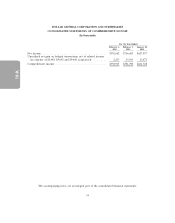
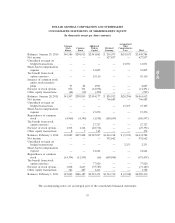
DOLLAR GENERAL CORPORATION AND SUBSIDIARIES
NOTES TO CONSOLIDATED FINANCIAL STATEMENTS
1. Basis of presentation and accounting policies
Basis of presentation
These notes contain references to the years 2012, 2011 and 2010, which represent fiscal years
ended February 1, 2013, February 3, 2012, and January 28, 2011, respectively. The Company’s fiscal
year ends on the Friday closest to January 31. 2012 and 2010 were 52-week accounting periods, while
2011 was a 53-week accounting period. The consolidated financial statements include all subsidiaries of
the Company, except for its not-for-profit subsidiary which the Company does not control.
Intercompany transactions have been eliminated.
Business description
The Company sells general merchandise on a retail basis through 10,506 stores (as of February 1,
2013) in 40 states covering most of the southern, southwestern, midwestern and eastern United States.
The Company owns distribution centers (‘‘DCs’’) in Scottsville, Kentucky; South Boston, Virginia;
Alachua, Florida; Zanesville, Ohio; Jonesville, South Carolina; Marion, Indiana, and Bessemer,
Alabama, and leases DCs in Ardmore, Oklahoma; Fulton, Missouri; Indianola, Mississippi; and Lebec,
California.
The Company purchases its merchandise from a wide variety of suppliers. Approximately 8% and
7% of the Company’s purchases in 2012 were made from the Company’s largest and second largest
suppliers, respectively.
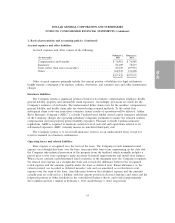
Cash and cash equivalents
Cash and cash equivalents include highly liquid investments with insignificant interest rate risk and
original maturities of three months or less when purchased. Such investments primarily consist of
money market funds, bank deposits, certificates of deposit (which may include foreign time deposits),
and commercial paper. The carrying amounts of these items are a reasonable estimate of their fair
value due to the short maturity of these investments.
Payments due from processors for electronic tender transactions classified as cash and cash
equivalents totaled approximately $45.2 million and $38.7 million at February 1, 2013 and February 3,
2012, respectively.
At February 1, 2013, the Company maintained cash balances to meet a $20 million minimum
threshold set by insurance regulators, as further described below under ‘‘Insurance liabilities.’’
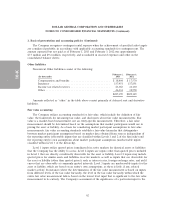
Investments in debt and equity securities
The Company accounts for investments in debt and marketable equity securities as
held-to-maturity, available-for-sale, or trading, depending on their classification. Debt securities
categorized as held-to-maturity are stated at amortized cost. Debt and equity securities categorized as
available-for-sale are stated at fair value, with any unrealized gains and losses, net of deferred income
taxes, reported as a component of Accumulated other comprehensive loss. Trading securities (primarily
mutual funds held pursuant to deferred compensation and supplemental retirement plans, as further
discussed below in Notes 7 and 10) are stated at fair value, with changes in fair value recorded as a
component of Selling, general and administrative (‘‘SG&A’’) expense.
57