Dollar General 2012 Annual Report Download - page 110
Download and view the complete annual report
Please find page 110 of the 2012 Dollar General annual report below. You can navigate through the pages in the report by either clicking on the pages listed below, or by using the keyword search tool below to find specific information within the annual report.-
 1
1 -
2
-
3
-
4
-
5
-
6
-
7
-
8
-
9
-
10
-
11
-
12
-
13
-
14
-
15
-
16
-
17
-
18
-
19
-
20
-
21
-
22
-
23
-
24
-
25
-
26
-
27
-
28
-
29
-
30
-
31
-
32
-
33
-
34
-
35
-
36
-
37
-
38
-
39
-
40
-
41
-
42
-
43
-
44
-
45
-
46
-
47
-
48
-
49
-
50
-
51
-
52
-
53
-
54
-
55
-
56
-
57
-
58
-
59
-
60
-
61
-
62
-
63
-
64
-
65
-
66
-
67
-
68
-
69
-
70
-
71
-
72
-
73
-
74
-
75
-
76
-
77
-
78
-
79
-
80
-
81
-
82
-
83
-
84
-
85
-
86
-
87
-
88
-
89
-
90
-
91
-
92
-
93
-
94
-
95
-
96
-
97
-
98
-
99
-
 100
100 -
 101
101 -
 102
102 -
 103
103 -
 104
104 -
 105
105 -
 106
106 -
 107
107 -
 108
108 -
 109
109 -
 110
110 -
 111
111 -
 112
112 -
 113
113 -
 114
114 -
 115
115 -
 116
116 -
 117
117 -
 118
118 -
 119
119 -
 120
120 -
121
-
122
-
123
-
124
-
125
-
126
-
127
-
128
-
129
-
130
-
131
-
132
-
133
-
134
-
135
-
136
-
137
-
138
-
139
-
140
-
141
-
142
-
143
-
144
-
145
-
146
-
147
-
148
-
149
-
150
-
151
-
152
-
153
-
154
-
155
-
156
-
157
-
158
-
159
-
160
-
161
-
162
-
163
-
164
-
165
-
166
-
167
-
168
-
169
-
170
-
171
-
172
-
173
-
174
-
175
-
176
-
177
-
178
-
179
-
180
-
181
-
182
-
183
-
184
-
185
-
186
-
187
-
188
-
189
-
190
-
191
-
192
-
193
-
194
-
195
-
196
-
197
 |
 |

10-K
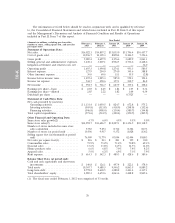
• Gross profit, as a percentage of sales;
• Selling, general and administrative expenses, as a percentage of sales;
• Operating profit;
• Inventory turnover;
• Cash flow;
• Net income;
• Earnings per share;
• Earnings before interest, income taxes, depreciation and amortization;
• Return on invested capital; and
• Adjusted debt to Earnings before interest, income taxes, depreciation and amortization and rent
expense.
Readers should refer to the detailed discussion of our operating results below for additional
comments on financial performance in the current year periods as compared with the prior year
periods.
Results of Operations
Accounting Periods. The following text contains references to years 2012, 2011 and 2010, which
represent fiscal years ended February 1, 2013, February 3, 2012 and January 28, 2011, respectively. Our
fiscal year ends on the Friday closest to January 31. Fiscal year 2011 was a 53-week accounting period
and fiscal years 2012 and 2010 were 52-week accounting periods.
Seasonality. The nature of our business is seasonal to a certain extent. Primarily because of sales
of holiday-related merchandise, sales in our fourth quarter (November, December and January) have
historically been higher than sales achieved in each of the first three quarters of the fiscal year.
Expenses and, to a greater extent, operating profit vary by quarter. Results of a period shorter than a
full year may not be indicative of results expected for the entire year. Furthermore, the seasonal nature
of our business may affect comparisons between periods.
31