Dollar General 2012 Annual Report Download - page 106
Download and view the complete annual report
Please find page 106 of the 2012 Dollar General annual report below. You can navigate through the pages in the report by either clicking on the pages listed below, or by using the keyword search tool below to find specific information within the annual report.-
 1
1 -
2
-
3
-
4
-
5
-
6
-
7
-
8
-
9
-
10
-
11
-
12
-
13
-
14
-
15
-
16
-
17
-
18
-
19
-
20
-
21
-
22
-
23
-
24
-
25
-
26
-
27
-
28
-
29
-
30
-
31
-
32
-
33
-
34
-
35
-
36
-
37
-
38
-
39
-
40
-
41
-
42
-
43
-
44
-
45
-
46
-
47
-
48
-
49
-
50
-
51
-
52
-
53
-
54
-
55
-
56
-
57
-
58
-
59
-
60
-
61
-
62
-
63
-
64
-
65
-
66
-
67
-
68
-
69
-
70
-
71
-
72
-
73
-
74
-
75
-
76
-
77
-
78
-
79
-
80
-
81
-
82
-
83
-
84
-
85
-
86
-
87
-
88
-
89
-
90
-
91
-
92
-
93
-
94
-
95
-
 96
96 -
 97
97 -
 98
98 -
 99
99 -
 100
100 -
 101
101 -
 102
102 -
 103
103 -
 104
104 -
 105
105 -
 106
106 -
 107
107 -
 108
108 -
 109
109 -
 110
110 -
 111
111 -
 112
112 -
 113
113 -
 114
114 -
 115
115 -
 116
116 -
117
-
118
-
119
-
120
-
121
-
122
-
123
-
124
-
125
-
126
-
127
-
128
-
129
-
130
-
131
-
132
-
133
-
134
-
135
-
136
-
137
-
138
-
139
-
140
-
141
-
142
-
143
-
144
-
145
-
146
-
147
-
148
-
149
-
150
-
151
-
152
-
153
-
154
-
155
-
156
-
157
-
158
-
159
-
160
-
161
-
162
-
163
-
164
-
165
-
166
-
167
-
168
-
169
-
170
-
171
-
172
-
173
-
174
-
175
-
176
-
177
-
178
-
179
-
180
-
181
-
182
-
183
-
184
-
185
-
186
-
187
-
188
-
189
-
190
-
191
-
192
-
193
-
194
-
195
-
196
-
197
 |
 |

10-K
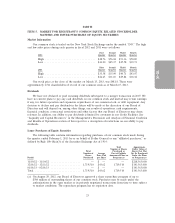
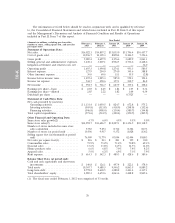
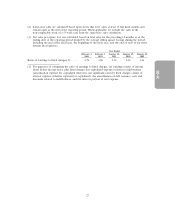
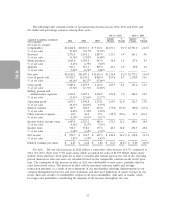
(2) Same-store sales are calculated based upon stores that were open at least 13 full fiscal months and
remain open at the end of the reporting period. When applicable, we exclude the sales in the
non-comparable week of a 53-week year from the same-store sales calculation.
(3) Net sales per square foot was calculated based on total sales for the preceding 12 months as of the
ending date of the reporting period divided by the average selling square footage during the period,
including the end of the fiscal year, the beginning of the fiscal year, and the end of each of our three
interim fiscal quarters.
Year Ended
February 1, February 3, January 28, January 29, January 30,
2013 2012 2011 2010 2009
Ratio of earnings to fixed charges(1): ..... 4.7x 3.8x 3.1x 2.1x 1.4x
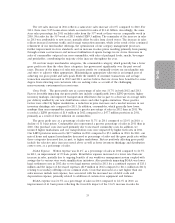
(1) For purposes of computing the ratio of earnings to fixed charges, (a) earnings consist of income
(loss) before income taxes, plus fixed charges less capitalized expenses related to indebtedness
(amortization expense for capitalized interest is not significant) and (b) fixed charges consist of
interest expense (whether expensed or capitalized), the amortization of debt issuance costs and
discounts related to indebtedness, and the interest portion of rent expense.
27