Delta Airlines 2010 Annual Report Download - page 97
Download and view the complete annual report
Please find page 97 of the 2010 Delta Airlines annual report below. You can navigate through the pages in the report by either clicking on the pages listed below, or by using the keyword search tool below to find specific information within the annual report.-
 1
1 -
2
-
3
-
4
-
5
-
6
-
7
-
8
-
9
-
10
-
11
-
12
-
13
-
14
-
15
-
16
-
17
-
18
-
19
-
20
-
21
-
22
-
23
-
24
-
25
-
26
-
27
-
28
-
29
-
30
-
31
-
32
-
33
-
34
-
35
-
36
-
37
-
38
-
39
-
40
-
41
-
42
-
43
-
44
-
45
-
46
-
47
-
48
-
49
-
50
-
51
-
52
-
53
-
54
-
55
-
56
-
57
-
58
-
59
-
60
-
61
-
62
-
63
-
64
-
65
-
66
-
67
-
68
-
69
-
70
-
71
-
72
-
73
-
74
-
75
-
76
-
77
-
78
-
79
-
80
-
81
-
82
-
83
-
84
-
85
-
86
-
 87
87 -
 88
88 -
 89
89 -
 90
90 -
 91
91 -
 92
92 -
 93
93 -
 94
94 -
 95
95 -
 96
96 -
 97
97 -
 98
98 -
 99
99 -
 100
100 -
 101
101 -
 102
102 -
 103
103 -
 104
104 -
 105
105 -
 106
106 -
 107
107 -
108
-
109
-
110
-
111
-
112
-
113
-
114
-
115
-
116
-
117
-
118
-
119
-
120
-
121
-
122
-
123
-
124
-
125
-
126
-
127
-
128
-
129
-
130
-
131
-
132
-
133
-
134
-
135
-
136
-
137
-
138
-
139
-
140
-
141
-
142
-
143
-
144
-
145
-
146
-
147
-
148
-
149
-
150
-
151
-
152
-
153
-
154
-
155
-
156
-
157
-
158
-
159
-
160
-
161
-
162
-
163
-
164
-
165
-
166
-
167
-
168
-
169
-
170
-
171
-
172
-
173
-
174
-
175
-
176
-
177
-
178
-
179
-
180
-
181
-
182
-
183
-
184
-
185
-
186
-
187
-
188
-
189
-
190
-
191
-
192
-
193
-
194
-
195
-
196
-
197
-
198
-
199
-
200
-
201
-
202
-
203
-
204
-
205
-
206
-
207
-
208
-
209
-
210
-
211
-
212
-
213
-
214
-
215
-
216
-
217
-
218
-
219
-
220
-
221
-
222
-
223
-
224
-
225
-
226
-
227
-
228
-
229
-
230
-
231
-
232
-
233
-
234
-
235
-
236
-
237
-
238
-
239
-
240
-
241
-
242
-
243
-
244
-
245
-
246
-
247
-
248
-
249
-
250
-
251
-
252
-
253
-
254
-
255
-
256
-
257
-
258
-
259
-
260
-
261
-
262
-
263
-
264
-
265
-
266
-
267
-
268
-
269
-
270
-
271
-
272
-
273
-
274
-
275
-
276
-
277
-
278
-
279
-
280
-
281
-
282
-
283
-
284
-
285
-
286
-
287
-
288
-
289
-
290
-
291
-
292
-
293
-
294
-
295
-
296
-
297
-
298
-
299
-
300
-
301
-
302
-
303
-
304
-
305
-
306
-
307
-
308
-
309
-
310
-
311
-
312
-
313
-
314
-
315
-
316
-
317
-
318
-
319
-
320
-
321
-
322
-
323
-
324
-
325
-
326
-
327
-
328
-
329
-
330
-
331
-
332
-
333
-
334
-
335
-
336
-
337
-
338
-
339
-
340
-
341
-
342
-
343
-
344
-
345
-
346
-
347
-
348
-
349
-
350
-
351
-
352
-
353
-
354
-
355
-
356
-
357
-
358
-
359
-
360
-
361
-
362
-
363
-
364
-
365
-
366
-
367
-
368
-
369
-
370
-
371
-
372
-
373
-
374
-
375
-
376
-
377
-
378
-
379
-
380
-
381
-
382
-
383
-
384
-
385
-
386
-
387
-
388
-
389
-
390
-
391
-
392
-
393
-
394
-
395
-
396
-
397
-
398
-
399
-
400
-
401
-
402
-
403
-
404
-
405
-
406
-
407
-
408
-
409
-
410
-
411
-
412
-
413
-
414
-
415
-
416
-
417
-
418
-
419
-
420
-
421
-
422
-
423
-
424
-
425
-
426
-
427
-
428
-
429
-
430
-
431
-
432
-
433
-
434
-
435
-
436
-
437
-
438
-
439
-
440
-
441
-
442
-
443
-
444
-
445
-
446
-
447
 |
 |
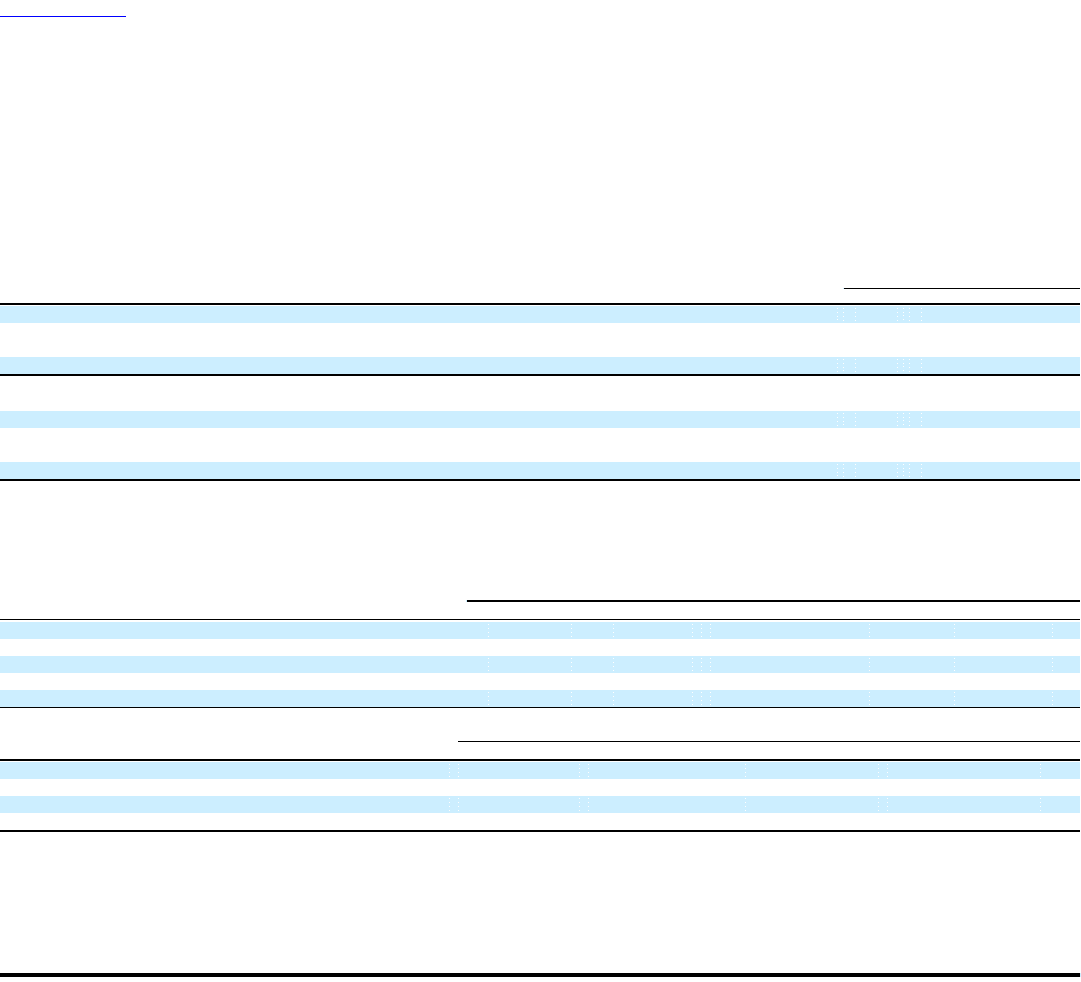
Table of Contents
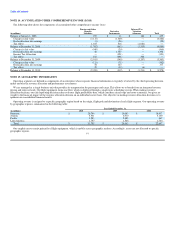
NOTE 17. EARNINGS (LOSS) PER SHARE
We calculate basic earnings (loss) per share by dividing the net income (loss) by the weighted average number of common shares outstanding. Shares
issuable upon the satisfaction of certain conditions are considered outstanding and included in the computation of basic earnings (loss) per share. Accordingly,
the calculation of basic earnings (loss) per share for the years ended December 31, 2010, 2009 and 2008 assumes there was outstanding at the beginning of
each of these periods all 386 million shares of Delta common stock contemplated by Delta's Plan of Reorganization to be distributed to holders of allowed
general, unsecured claims. Similarly, the calculation of basic loss per share for the years ended December 31, 2009 and 2008 assumes there was outstanding at
January 1, 2009 and the Closing Date, respectively, the following shares in connection with the Merger (1) 50 million shares of Delta common stock we
agreed to issue on behalf of pilots and (2) nine million shares of Delta common stock reserved for issuance in exchange for shares of Northwest common
stock that, but for the Merger, would have been issued under Northwest's Plan of Reorganization.
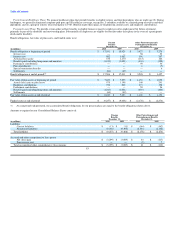
The following table shows our computation of basic and diluted earnings (loss) per share:
Year Ended December 31,
(in millions, except per share data) 2010 2009 2008
Net income (loss) $ 593 $ (1,237) $ (8,922)
Basic weighted average shares outstanding 834 827 468
Dilutive effects of share based awards 9 — —
Diluted weighted average shares outstanding 843 827 468
Basic earnings (loss) per share $ 0.71 $ (1.50) $ (19.08)
Diluted earnings (loss) per share $ 0.70 $ (1.50) $ (19.08)
Antidilutive common stock equivalents excluded from diluted earnings (loss) per share 22 35 41
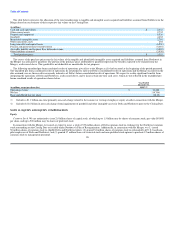
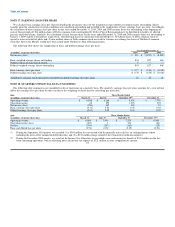
NOTE 18. QUARTERLY FINANCIAL DATA (UNAUDITED)
The following table summarizes our unaudited results of operations on a quarterly basis. The quarterly earnings (loss) per share amounts for a year will not
add to the earnings (loss) per share for that year due to the weighting of shares used in calculating per share data.
2010 Three Months Ended
(in millions, except per share data) March 31 June 30 September 30(1) December 31
Operating revenue $ 6,848 $ 8,168 $ 8,950 $ 7,789
Operating income 68 852 1,003 294
Net income (loss) (256) 467 363 19
Basic earnings (loss) per share (0.31) 0.56 0.43 0.02
Diluted earnings (loss) per share (0.31) 0.55 0.43 0.02
2009 Three Months Ended
(in millions, except per share data) March 31 June 30 September 30 December 31(2)
Operating revenue $ 6,684 $ 7,000 $ 7,574 $ 6,805
Operating income (loss) (483) 1 204 (46)
Net loss (794) (257) (161) (25)
Basic and diluted loss per share (0.96) (0.31) (0.19) (0.03)
(1) During the September 2010 quarter, we recorded (1) a $360 million loss associated with the primarily non-cash loss on extinguishment of debt,
including the write-off of unamortized debt discount, and (2) a $153 million charge related to the Comair fleet reduction initiative.
(2) During the December 2009 quarter, as a result of the Income Tax Allocation, we recorded a non-cash income tax benefit of $321 million on the loss
from continuing operations, with an offsetting non-cash income tax expense of $321 million in other comprehensive income.
93