Delta Airlines 2010 Annual Report Download - page 40
Download and view the complete annual report
Please find page 40 of the 2010 Delta Airlines annual report below. You can navigate through the pages in the report by either clicking on the pages listed below, or by using the keyword search tool below to find specific information within the annual report.-
 1
1 -
2
-
3
-
4
-
5
-
6
-
7
-
8
-
9
-
10
-
11
-
12
-
13
-
14
-
15
-
16
-
17
-
18
-
19
-
20
-
21
-
22
-
23
-
24
-
25
-
26
-
27
-
28
-
29
-
 30
30 -
 31
31 -
 32
32 -
 33
33 -
 34
34 -
 35
35 -
 36
36 -
 37
37 -
 38
38 -
 39
39 -
 40
40 -
 41
41 -
 42
42 -
 43
43 -
 44
44 -
 45
45 -
 46
46 -
 47
47 -
 48
48 -
 49
49 -
 50
50 -
51
-
52
-
53
-
54
-
55
-
56
-
57
-
58
-
59
-
60
-
61
-
62
-
63
-
64
-
65
-
66
-
67
-
68
-
69
-
70
-
71
-
72
-
73
-
74
-
75
-
76
-
77
-
78
-
79
-
80
-
81
-
82
-
83
-
84
-
85
-
86
-
87
-
88
-
89
-
90
-
91
-
92
-
93
-
94
-
95
-
96
-
97
-
98
-
99
-
100
-
101
-
102
-
103
-
104
-
105
-
106
-
107
-
108
-
109
-
110
-
111
-
112
-
113
-
114
-
115
-
116
-
117
-
118
-
119
-
120
-
121
-
122
-
123
-
124
-
125
-
126
-
127
-
128
-
129
-
130
-
131
-
132
-
133
-
134
-
135
-
136
-
137
-
138
-
139
-
140
-
141
-
142
-
143
-
144
-
145
-
146
-
147
-
148
-
149
-
150
-
151
-
152
-
153
-
154
-
155
-
156
-
157
-
158
-
159
-
160
-
161
-
162
-
163
-
164
-
165
-
166
-
167
-
168
-
169
-
170
-
171
-
172
-
173
-
174
-
175
-
176
-
177
-
178
-
179
-
180
-
181
-
182
-
183
-
184
-
185
-
186
-
187
-
188
-
189
-
190
-
191
-
192
-
193
-
194
-
195
-
196
-
197
-
198
-
199
-
200
-
201
-
202
-
203
-
204
-
205
-
206
-
207
-
208
-
209
-
210
-
211
-
212
-
213
-
214
-
215
-
216
-
217
-
218
-
219
-
220
-
221
-
222
-
223
-
224
-
225
-
226
-
227
-
228
-
229
-
230
-
231
-
232
-
233
-
234
-
235
-
236
-
237
-
238
-
239
-
240
-
241
-
242
-
243
-
244
-
245
-
246
-
247
-
248
-
249
-
250
-
251
-
252
-
253
-
254
-
255
-
256
-
257
-
258
-
259
-
260
-
261
-
262
-
263
-
264
-
265
-
266
-
267
-
268
-
269
-
270
-
271
-
272
-
273
-
274
-
275
-
276
-
277
-
278
-
279
-
280
-
281
-
282
-
283
-
284
-
285
-
286
-
287
-
288
-
289
-
290
-
291
-
292
-
293
-
294
-
295
-
296
-
297
-
298
-
299
-
300
-
301
-
302
-
303
-
304
-
305
-
306
-
307
-
308
-
309
-
310
-
311
-
312
-
313
-
314
-
315
-
316
-
317
-
318
-
319
-
320
-
321
-
322
-
323
-
324
-
325
-
326
-
327
-
328
-
329
-
330
-
331
-
332
-
333
-
334
-
335
-
336
-
337
-
338
-
339
-
340
-
341
-
342
-
343
-
344
-
345
-
346
-
347
-
348
-
349
-
350
-
351
-
352
-
353
-
354
-
355
-
356
-
357
-
358
-
359
-
360
-
361
-
362
-
363
-
364
-
365
-
366
-
367
-
368
-
369
-
370
-
371
-
372
-
373
-
374
-
375
-
376
-
377
-
378
-
379
-
380
-
381
-
382
-
383
-
384
-
385
-
386
-
387
-
388
-
389
-
390
-
391
-
392
-
393
-
394
-
395
-
396
-
397
-
398
-
399
-
400
-
401
-
402
-
403
-
404
-
405
-
406
-
407
-
408
-
409
-
410
-
411
-
412
-
413
-
414
-
415
-
416
-
417
-
418
-
419
-
420
-
421
-
422
-
423
-
424
-
425
-
426
-
427
-
428
-
429
-
430
-
431
-
432
-
433
-
434
-
435
-
436
-
437
-
438
-
439
-
440
-
441
-
442
-
443
-
444
-
445
-
446
-
447
 |
 |

Table of Contents
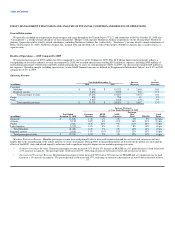
Cash provided by financing activities totaled $1.7 billion for 2008, primarily reflecting (1) $1.0 billion in borrowings under a revolving credit facility, (2)
$1.0 billion received under the American Express Agreement for an advance purchase of SkyMiles and (3) $1.0 billion from aircraft financing. Cash provided
by financing activities was partially offset by the repayment of $1.6 billion of long-term debt and capital lease obligations.
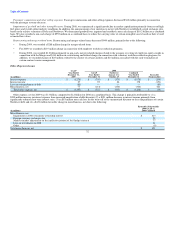
Contractual Obligations
The following table summarizes our contractual obligations at December 31, 2010 that we expect will be paid in cash. The table does not include amounts
that are contingent on events or other factors that are uncertain or unknown at this time, including legal contingencies, uncertain tax positions, and amounts
payable under collective bargaining arrangements, among others. In addition, the table does not include expected significant cash payments which are
generally ordinary course of business obligations that do not include contractual commitments.
The amounts presented are based on various estimates, including estimates regarding the timing of payments, prevailing interest rates, volumes purchased,
the occurrence of certain events and other factors. Accordingly, the actual results may vary materially from the amounts presented in the table.
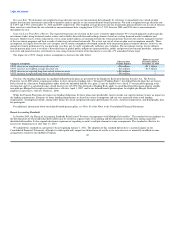
During 2010, the following significant events impacted our contractual obligations:
• Our JFK redevelopment initiative. Estimated amounts payable by us under our new 33 year sublease are included in operating lease payments
below.
• Our agreement with The Boeing Company to reaffirm our previous orders for 18 B-787-8 aircraft and to defer delivery of those aircraft from
2008-2010 to 2020-2022. Our estimated payments to purchase these aircraft are included in aircraft purchase obligations below.
• Our sale of Compass and Mesaba. Our estimated minimum fixed obligations under our capacity purchase agreements with these airlines are
included in contract carrier obligations below.
Contractual Obligations by Year
(in millions) 2011 2012 2013 2014 2015 Thereafter Total
Long-term debt
Principal amount $ 2,004 $ 2,041 $ 1,443 $ 2,793 $ 1,271 $ 4,890 $ 14,442
Interest payments 750 650 560 480 310 1,010 3,760
Contract carrier obligations 2,080 1,970 2,040 2,050 2,020 6,740 16,900
Operating lease payments 1,420 1,351 1,320 1,263 1,169 8,423 14,946
Employee benefit obligations 730 810 730 710 700 9,370 13,050
Aircraft purchase commitments 60 — — — — 2,500 2,560
Capital lease obligations 214 193 160 130 124 404 1,225
Other obligations 380 220 140 60 60 300 1,160
Total $ 7,638 $ 7,235 $ 6,393 $ 7,486 $ 5,654 $ 33,637 $ 68,043
Long-Term Debt, Principal Amount. Represents scheduled principal payments on long-term debt reported on our Consolidated Balance Sheet at
December 31, 2010. The table excludes $1.0 billion we received from American Express for its advance purchase of SkyMiles because this obligation will be
satisfied by American Express' use of SkyMiles over a specified period rather than by cash payments from us. For additional information about our long-term
debt and agreement with American Express, see Note 5 of the Notes to the Consolidated Financial Statements.
Long-Term Debt, Interest Payments. Represents estimated interest payments under our long-term debt based on the interest rates specified in the applicable
debt agreements. Interest payments on variable interest rate debt were calculated using LIBOR at December 31, 2010. For additional information, see Note 5
of the Notes to the Consolidated Financial Statements.
Contract Carrier Obligations. Represents our estimated minimum fixed obligations under capacity purchase agreements with regional carriers (excluding
Comair). The reported amounts are based on (1) the required minimum levels of flying by our contract carriers under the applicable agreements and
(2) assumptions regarding the costs associated with such minimum levels of flying. For additional information about our capacity purchase agreements, see
Note 7 of the Notes to the Consolidated Financial Statements.
Operating Lease Payments. Includes our noncancelable operating leases. For additional information, see Note 6 and Note 8 of the Notes to the
Consolidated Financial Statements.
36