Delta Airlines 2010 Annual Report Download - page 58
Download and view the complete annual report
Please find page 58 of the 2010 Delta Airlines annual report below. You can navigate through the pages in the report by either clicking on the pages listed below, or by using the keyword search tool below to find specific information within the annual report.-
 1
1 -
2
-
3
-
4
-
5
-
6
-
7
-
8
-
9
-
10
-
11
-
12
-
13
-
14
-
15
-
16
-
17
-
18
-
19
-
20
-
21
-
22
-
23
-
24
-
25
-
26
-
27
-
28
-
29
-
30
-
31
-
32
-
33
-
34
-
35
-
36
-
37
-
38
-
39
-
40
-
41
-
42
-
43
-
44
-
45
-
46
-
47
-
 48
48 -
 49
49 -
 50
50 -
 51
51 -
 52
52 -
 53
53 -
 54
54 -
 55
55 -
 56
56 -
 57
57 -
 58
58 -
 59
59 -
 60
60 -
 61
61 -
 62
62 -
 63
63 -
 64
64 -
 65
65 -
 66
66 -
 67
67 -
 68
68 -
69
-
70
-
71
-
72
-
73
-
74
-
75
-
76
-
77
-
78
-
79
-
80
-
81
-
82
-
83
-
84
-
85
-
86
-
87
-
88
-
89
-
90
-
91
-
92
-
93
-
94
-
95
-
96
-
97
-
98
-
99
-
100
-
101
-
102
-
103
-
104
-
105
-
106
-
107
-
108
-
109
-
110
-
111
-
112
-
113
-
114
-
115
-
116
-
117
-
118
-
119
-
120
-
121
-
122
-
123
-
124
-
125
-
126
-
127
-
128
-
129
-
130
-
131
-
132
-
133
-
134
-
135
-
136
-
137
-
138
-
139
-
140
-
141
-
142
-
143
-
144
-
145
-
146
-
147
-
148
-
149
-
150
-
151
-
152
-
153
-
154
-
155
-
156
-
157
-
158
-
159
-
160
-
161
-
162
-
163
-
164
-
165
-
166
-
167
-
168
-
169
-
170
-
171
-
172
-
173
-
174
-
175
-
176
-
177
-
178
-
179
-
180
-
181
-
182
-
183
-
184
-
185
-
186
-
187
-
188
-
189
-
190
-
191
-
192
-
193
-
194
-
195
-
196
-
197
-
198
-
199
-
200
-
201
-
202
-
203
-
204
-
205
-
206
-
207
-
208
-
209
-
210
-
211
-
212
-
213
-
214
-
215
-
216
-
217
-
218
-
219
-
220
-
221
-
222
-
223
-
224
-
225
-
226
-
227
-
228
-
229
-
230
-
231
-
232
-
233
-
234
-
235
-
236
-
237
-
238
-
239
-
240
-
241
-
242
-
243
-
244
-
245
-
246
-
247
-
248
-
249
-
250
-
251
-
252
-
253
-
254
-
255
-
256
-
257
-
258
-
259
-
260
-
261
-
262
-
263
-
264
-
265
-
266
-
267
-
268
-
269
-
270
-
271
-
272
-
273
-
274
-
275
-
276
-
277
-
278
-
279
-
280
-
281
-
282
-
283
-
284
-
285
-
286
-
287
-
288
-
289
-
290
-
291
-
292
-
293
-
294
-
295
-
296
-
297
-
298
-
299
-
300
-
301
-
302
-
303
-
304
-
305
-
306
-
307
-
308
-
309
-
310
-
311
-
312
-
313
-
314
-
315
-
316
-
317
-
318
-
319
-
320
-
321
-
322
-
323
-
324
-
325
-
326
-
327
-
328
-
329
-
330
-
331
-
332
-
333
-
334
-
335
-
336
-
337
-
338
-
339
-
340
-
341
-
342
-
343
-
344
-
345
-
346
-
347
-
348
-
349
-
350
-
351
-
352
-
353
-
354
-
355
-
356
-
357
-
358
-
359
-
360
-
361
-
362
-
363
-
364
-
365
-
366
-
367
-
368
-
369
-
370
-
371
-
372
-
373
-
374
-
375
-
376
-
377
-
378
-
379
-
380
-
381
-
382
-
383
-
384
-
385
-
386
-
387
-
388
-
389
-
390
-
391
-
392
-
393
-
394
-
395
-
396
-
397
-
398
-
399
-
400
-
401
-
402
-
403
-
404
-
405
-
406
-
407
-
408
-
409
-
410
-
411
-
412
-
413
-
414
-
415
-
416
-
417
-
418
-
419
-
420
-
421
-
422
-
423
-
424
-
425
-
426
-
427
-
428
-
429
-
430
-
431
-
432
-
433
-
434
-
435
-
436
-
437
-
438
-
439
-
440
-
441
-
442
-
443
-
444
-
445
-
446
-
447
 |
 |
Table of Contents
Regional Carriers Revenue. During the year ended December 31, 2010, we had contract carrier agreements with 10 Contract Carriers, including our
wholly-owned subsidiary, Comair, Inc. ("Comair"). Our Contract Carrier agreements are structured as either (1) capacity purchase agreements where we
purchase all or a portion of the Contract Carrier's capacity and are responsible for selling the seat inventory we purchase or (2) revenue proration agreements,
which are based on a fixed dollar or percentage division of revenues for tickets sold to passengers traveling on connecting flight itineraries. We record
revenue related to all of our Contract Carrier agreements as regional carriers passenger revenue. We record expenses related to our Contract Carrier
agreements, excluding Comair, as contract carrier arrangements expense.
Cargo Revenue
Cargo revenue is recognized in our Consolidated Statements of Operations when we provide the transportation.
Other Revenue
Other revenue includes revenue from (1) the Marketing Premium component of the sale of mileage credits discussed above, (2) baggage handling fees,
(3) the sale of seats on other airlines' flights under alliance agreements and (4) other miscellaneous service revenue, including administrative service charges
and revenue from ancillary businesses, such as the aircraft maintenance and repair and staffing services we provide to third parties. Revenue from other
airlines' sale of seats on our flights under alliance agreements is recorded in passenger revenue on our Consolidated Statements of Operations.
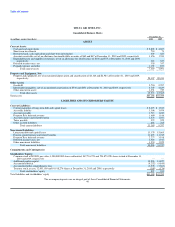
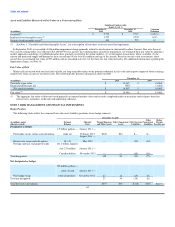
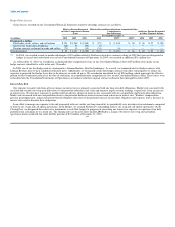
Long-Lived Assets
The following table shows our property and equipment:
December 31,
(in millions) 2010 2009
Flight equipment $ 20,312 $ 19,513
Accumulated depreciation (2,605) (1,731)
Flight equipment, net 17,707 17,782
Ground property and equipment 3,123 2,936
Accumulated depreciation (1,214) (949)
Ground property and equipment, net 1,909 1,987
Flight and ground equipment under capital leases 988 717
Accumulated amortization (345) (244)
Flight and ground equipment under capital leases, net 643 473
Advance payments for equipment 48 191
Total property and equipment, net $ 20,307 $ 20,433
We record property and equipment at cost and depreciate or amortize these assets on a straight-line basis to their estimated residual values over their
estimated useful lives. Residual values for owned spare parts and simulators are generally 5% of cost except when guaranteed by a third party for a different
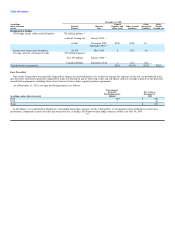
amount. The estimated useful lives for major asset classifications are as follows:
Asset Classification Estimated Useful Life
Flight equipment 21-30 years
Capitalized software(1) 3-7 years
Ground property and equipment 3-40 years
Leasehold improvements(2) Shorter of lease term or estimated useful life
Flight equipment under capital lease Shorter of lease term or estimated useful life
(1) We capitalize certain internal and external costs incurred to develop and implement software. For the years ended December 31, 2010, 2009 and 2008,
we recorded $71 million, $95 million and $99 million, respectively, for amortization of capitalized software. The net book value of these assets totaled
$153 million and $126 million at December 31, 2010 and 2009, respectively.
(2) For leasehold improvements at certain airport facilities, we apply estimated useful lives which extend beyond the contractual lease terms.
54