Delta Airlines 2010 Annual Report Download - page 33
Download and view the complete annual report
Please find page 33 of the 2010 Delta Airlines annual report below. You can navigate through the pages in the report by either clicking on the pages listed below, or by using the keyword search tool below to find specific information within the annual report.-
 1
1 -
2
-
3
-
4
-
5
-
6
-
7
-
8
-
9
-
10
-
11
-
12
-
13
-
14
-
15
-
16
-
17
-
18
-
19
-
20
-
21
-
22
-
 23
23 -
 24
24 -
 25
25 -
 26
26 -
 27
27 -
 28
28 -
 29
29 -
 30
30 -
 31
31 -
 32
32 -
 33
33 -
 34
34 -
 35
35 -
 36
36 -
 37
37 -
 38
38 -
 39
39 -
 40
40 -
 41
41 -
 42
42 -
 43
43 -
44
-
45
-
46
-
47
-
48
-
49
-
50
-
51
-
52
-
53
-
54
-
55
-
56
-
57
-
58
-
59
-
60
-
61
-
62
-
63
-
64
-
65
-
66
-
67
-
68
-
69
-
70
-
71
-
72
-
73
-
74
-
75
-
76
-
77
-
78
-
79
-
80
-
81
-
82
-
83
-
84
-
85
-
86
-
87
-
88
-
89
-
90
-
91
-
92
-
93
-
94
-
95
-
96
-
97
-
98
-
99
-
100
-
101
-
102
-
103
-
104
-
105
-
106
-
107
-
108
-
109
-
110
-
111
-
112
-
113
-
114
-
115
-
116
-
117
-
118
-
119
-
120
-
121
-
122
-
123
-
124
-
125
-
126
-
127
-
128
-
129
-
130
-
131
-
132
-
133
-
134
-
135
-
136
-
137
-
138
-
139
-
140
-
141
-
142
-
143
-
144
-
145
-
146
-
147
-
148
-
149
-
150
-
151
-
152
-
153
-
154
-
155
-
156
-
157
-
158
-
159
-
160
-
161
-
162
-
163
-
164
-
165
-
166
-
167
-
168
-
169
-
170
-
171
-
172
-
173
-
174
-
175
-
176
-
177
-
178
-
179
-
180
-
181
-
182
-
183
-
184
-
185
-
186
-
187
-
188
-
189
-
190
-
191
-
192
-
193
-
194
-
195
-
196
-
197
-
198
-
199
-
200
-
201
-
202
-
203
-
204
-
205
-
206
-
207
-
208
-
209
-
210
-
211
-
212
-
213
-
214
-
215
-
216
-
217
-
218
-
219
-
220
-
221
-
222
-
223
-
224
-
225
-
226
-
227
-
228
-
229
-
230
-
231
-
232
-
233
-
234
-
235
-
236
-
237
-
238
-
239
-
240
-
241
-
242
-
243
-
244
-
245
-
246
-
247
-
248
-
249
-
250
-
251
-
252
-
253
-
254
-
255
-
256
-
257
-
258
-
259
-
260
-
261
-
262
-
263
-
264
-
265
-
266
-
267
-
268
-
269
-
270
-
271
-
272
-
273
-
274
-
275
-
276
-
277
-
278
-
279
-
280
-
281
-
282
-
283
-
284
-
285
-
286
-
287
-
288
-
289
-
290
-
291
-
292
-
293
-
294
-
295
-
296
-
297
-
298
-
299
-
300
-
301
-
302
-
303
-
304
-
305
-
306
-
307
-
308
-
309
-
310
-
311
-
312
-
313
-
314
-
315
-
316
-
317
-
318
-
319
-
320
-
321
-
322
-
323
-
324
-
325
-
326
-
327
-
328
-
329
-
330
-
331
-
332
-
333
-
334
-
335
-
336
-
337
-
338
-
339
-
340
-
341
-
342
-
343
-
344
-
345
-
346
-
347
-
348
-
349
-
350
-
351
-
352
-
353
-
354
-
355
-
356
-
357
-
358
-
359
-
360
-
361
-
362
-
363
-
364
-
365
-
366
-
367
-
368
-
369
-
370
-
371
-
372
-
373
-
374
-
375
-
376
-
377
-
378
-
379
-
380
-
381
-
382
-
383
-
384
-
385
-
386
-
387
-
388
-
389
-
390
-
391
-
392
-
393
-
394
-
395
-
396
-
397
-
398
-
399
-
400
-
401
-
402
-
403
-
404
-
405
-
406
-
407
-
408
-
409
-
410
-
411
-
412
-
413
-
414
-
415
-
416
-
417
-
418
-
419
-
420
-
421
-
422
-
423
-
424
-
425
-
426
-
427
-
428
-
429
-
430
-
431
-
432
-
433
-
434
-
435
-
436
-
437
-
438
-
439
-
440
-
441
-
442
-
443
-
444
-
445
-
446
-
447
 |
 |

Table of Contents
Restructuring and merger-related items. Restructuring and merger-related items increased primarily due to the following:
• During 2010, we recorded a $268 million charge primarily for merger-related items and $182 million in asset impairment charges related to the
initiative to substantially reduce our 50-seat aircraft and the retired dedicated freighter aircraft.
• During 2009, we recorded a $288 million charge primarily for merger-related items and a $119 million charge in connection with employee
workforce reduction programs.
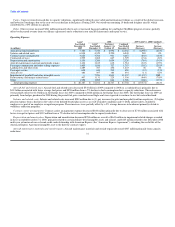
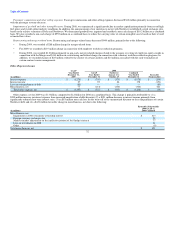
Other (Expense) Income
Other expense, net for 2010 was $1.6 billion, compared to $1.3 billion for 2009. This change is attributable to the following:
(Unfavorable) Favorable vs.
Year Ended
(in millions) December 31, 2009
Loss on extinguishment of debt $ (308)
Net interest expense (88)
Mark-to-market adjustments on the ineffective portion of fuel hedge contracts (61)
Foreign currency exchange rates (52)
Amortization of debt discount, net 154
Other 3
Total other expense, net $ (352)
For additional information regarding our loss on extinguishment of debt and amortization of debt discount, net, see Note 5 of the Notes to the Consolidated
Financial Statements.
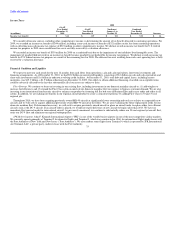
Income Taxes
We consider all income sources, including other comprehensive income, in determining the amount of tax benefit allocated to continuing operations. For
2010, we recorded an income tax provision of $15 million, primarily related to international and state income taxes. We did not record an income tax
provision for U.S. federal income tax purposes since our deferred tax assets are fully reserved by a valuation allowance.
For 2009, we recorded an income tax benefit of $344 million, including a non-cash income tax benefit of $321 million on the loss from continuing
operations, with an offsetting non-cash income tax expense of $321 million on other comprehensive income. We did not record an income tax benefit for U.S.
federal income tax purposes in 2009 since our deferred tax assets are fully reserved by a valuation allowance.
At December 31, 2010, we had $17.1 billion of U.S. federal pre-tax net operating loss carryforwards. Accordingly, we believe we will not pay any cash
federal income taxes during the next several years. Our U.S. federal pre-tax net operating loss carryforwards do not begin to expire until 2022.
Results of Operations — 2009 GAAP Compared to 2008 Combined
In this section, we compare Delta's results of operations under GAAP for the year ended December 31, 2009 with Delta's results of operations on a
combined basis for the year ended December 31, 2008. For this purpose, Delta's results of operations for 2008 on a combined basis add (1) Delta's results of
operations under GAAP for 2008, which includes Northwest's results of operations from October 30 to December 31, 2008 and (2) Northwest's results of
operations from January 1 to October 29, 2008. This presentation of the 2008 financial results provides a more meaningful basis for comparing Delta's
financial performance in 2009 and 2008.
29