Delta Airlines 2010 Annual Report Download - page 31
Download and view the complete annual report
Please find page 31 of the 2010 Delta Airlines annual report below. You can navigate through the pages in the report by either clicking on the pages listed below, or by using the keyword search tool below to find specific information within the annual report.-
 1
1 -
2
-
3
-
4
-
5
-
6
-
7
-
8
-
9
-
10
-
11
-
12
-
13
-
14
-
15
-
16
-
17
-
18
-
19
-
20
-
 21
21 -
 22
22 -
 23
23 -
 24
24 -
 25
25 -
 26
26 -
 27
27 -
 28
28 -
 29
29 -
 30
30 -
 31
31 -
 32
32 -
 33
33 -
 34
34 -
 35
35 -
 36
36 -
 37
37 -
 38
38 -
 39
39 -
 40
40 -
 41
41 -
42
-
43
-
44
-
45
-
46
-
47
-
48
-
49
-
50
-
51
-
52
-
53
-
54
-
55
-
56
-
57
-
58
-
59
-
60
-
61
-
62
-
63
-
64
-
65
-
66
-
67
-
68
-
69
-
70
-
71
-
72
-
73
-
74
-
75
-
76
-
77
-
78
-
79
-
80
-
81
-
82
-
83
-
84
-
85
-
86
-
87
-
88
-
89
-
90
-
91
-
92
-
93
-
94
-
95
-
96
-
97
-
98
-
99
-
100
-
101
-
102
-
103
-
104
-
105
-
106
-
107
-
108
-
109
-
110
-
111
-
112
-
113
-
114
-
115
-
116
-
117
-
118
-
119
-
120
-
121
-
122
-
123
-
124
-
125
-
126
-
127
-
128
-
129
-
130
-
131
-
132
-
133
-
134
-
135
-
136
-
137
-
138
-
139
-
140
-
141
-
142
-
143
-
144
-
145
-
146
-
147
-
148
-
149
-
150
-
151
-
152
-
153
-
154
-
155
-
156
-
157
-
158
-
159
-
160
-
161
-
162
-
163
-
164
-
165
-
166
-
167
-
168
-
169
-
170
-
171
-
172
-
173
-
174
-
175
-
176
-
177
-
178
-
179
-
180
-
181
-
182
-
183
-
184
-
185
-
186
-
187
-
188
-
189
-
190
-
191
-
192
-
193
-
194
-
195
-
196
-
197
-
198
-
199
-
200
-
201
-
202
-
203
-
204
-
205
-
206
-
207
-
208
-
209
-
210
-
211
-
212
-
213
-
214
-
215
-
216
-
217
-
218
-
219
-
220
-
221
-
222
-
223
-
224
-
225
-
226
-
227
-
228
-
229
-
230
-
231
-
232
-
233
-
234
-
235
-
236
-
237
-
238
-
239
-
240
-
241
-
242
-
243
-
244
-
245
-
246
-
247
-
248
-
249
-
250
-
251
-
252
-
253
-
254
-
255
-
256
-
257
-
258
-
259
-
260
-
261
-
262
-
263
-
264
-
265
-
266
-
267
-
268
-
269
-
270
-
271
-
272
-
273
-
274
-
275
-
276
-
277
-
278
-
279
-
280
-
281
-
282
-
283
-
284
-
285
-
286
-
287
-
288
-
289
-
290
-
291
-
292
-
293
-
294
-
295
-
296
-
297
-
298
-
299
-
300
-
301
-
302
-
303
-
304
-
305
-
306
-
307
-
308
-
309
-
310
-
311
-
312
-
313
-
314
-
315
-
316
-
317
-
318
-
319
-
320
-
321
-
322
-
323
-
324
-
325
-
326
-
327
-
328
-
329
-
330
-
331
-
332
-
333
-
334
-
335
-
336
-
337
-
338
-
339
-
340
-
341
-
342
-
343
-
344
-
345
-
346
-
347
-
348
-
349
-
350
-
351
-
352
-
353
-
354
-
355
-
356
-
357
-
358
-
359
-
360
-
361
-
362
-
363
-
364
-
365
-
366
-
367
-
368
-
369
-
370
-
371
-
372
-
373
-
374
-
375
-
376
-
377
-
378
-
379
-
380
-
381
-
382
-
383
-
384
-
385
-
386
-
387
-
388
-
389
-
390
-
391
-
392
-
393
-
394
-
395
-
396
-
397
-
398
-
399
-
400
-
401
-
402
-
403
-
404
-
405
-
406
-
407
-
408
-
409
-
410
-
411
-
412
-
413
-
414
-
415
-
416
-
417
-
418
-
419
-
420
-
421
-
422
-
423
-
424
-
425
-
426
-
427
-
428
-
429
-
430
-
431
-
432
-
433
-
434
-
435
-
436
-
437
-
438
-
439
-
440
-
441
-
442
-
443
-
444
-
445
-
446
-
447
 |
 |

Table of Contents
ITEM 7. MANAGEMENT'S DISCUSSION AND ANALYSIS OF FINANCIAL CONDITION AND RESULTS OF OPERATIONS
General Information
We provide scheduled air transportation for passengers and cargo throughout the United States ("U.S.") and around the world. On October 29, 2008 (the
"Closing Date"), a wholly-owned subsidiary of ours merged (the "Merger") with and into Northwest Airlines Corporation. On the Closing Date, Northwest
Airlines Corporation and its wholly-owned subsidiaries, including Northwest Airlines, Inc. (collectively, "Northwest"), became wholly-owned subsidiaries of
Delta. On December 31, 2009, Northwest Airlines, Inc. merged with and into Delta. As a result of this merger, Northwest Airlines, Inc. ceased to exist as a
separate entity.
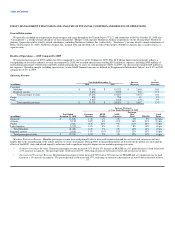
Results of Operations — 2010 Compared to 2009
We reported net income of $593 million for 2010, compared to a net loss of $1.2 billion for 2009. This $1.8 billion improvement primarily reflects a
strengthening of the airline industry revenue environment. In 2010, we recorded special items totaling $851 million in expenses, including $450 million of
restructuring and merger-related items and $401 million primarily due to a loss on extinguishment of debt. In 2009, our special items totaled $169 million in
net expenses. Operating margin excluding special items (a non-GAAP financial measure as defined in "Supplemental Information" below) was 8.4% in 2010,
compared to 0.3% in 2009.
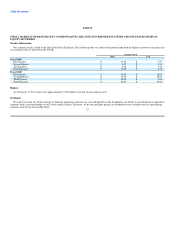
Operating Revenue
%
Year Ended December 31, Increase Increase
(in millions) 2010 2009 (Decrease) (Decrease)
Passenger:
Mainline $ 21,408 $ 18,522 $ 2,886 16%
Regional carriers 5,850 5,285 565 11%
Total passenger revenue 27,258 23,807 3,451 14%
Cargo 850 788 62 8%
Other 3,647 3,468 179 5%
Total operating revenue $ 31,755 $ 28,063 $ 3,692 13%
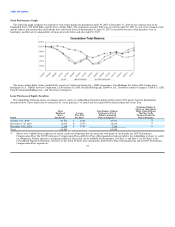
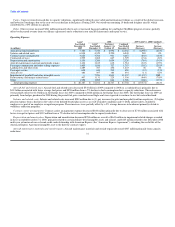
Increase (Decrease)
vs. Year Ended December 31, 2009
Passenger
Year Ended Passenger RPMs ASMs Mile Load
(in millions) December 31, 2010 Revenue (Traffic) (Capacity) Yield PRASM Factor
Domestic $ 11,878 11% 1% 2% 9% 9% (0.3)pts
Atlantic 5,152 18% 0% (3)% 18% 21% 2.3 pts
Pacific 2,806 38% 14% 9% 21% 26% 7.3 pts
Latin America 1,572 13% 4% 3% 8% 10% 1.0 pts
Total Mainline 21,408 16% 3% 2% 12% 14% 1.0 pts
Regional carriers 5,850 11% (1)% (2)% 12% 13% 1.0 pts
Total passenger revenue $ 27,258 14% 2% 1% 12% 13% 1.0 pts
Mainline Passenger Revenue. Mainline passenger revenue increased primarily due to increased business demand for air travel and an increase in fares,
largely due to the strengthening of the airline industry revenue environment. During 2009, weakened demand for air travel from the global recession and the
effects of the H1N1 virus and related capacity reductions had a significant negative impact on our mainline passenger revenue.
• Domestic Passenger Revenue. Domestic passenger revenue increased 11% from a 9% increase in PRASM on a 0.3 point decrease in load factor and
a 2% increase in capacity. The passenger mile yield increased 9%, reflecting an increase in business travel and an increase in fares.
• International Passenger Revenue. International passenger revenue increased 22% from a 21% increase in PRASM and a 2.4 point increase in load
factor on a 1% increase in capacity. The passenger mile yield increased 17%, reflecting an increase in demand for air travel and an increase in fares.
27